
When the Sky Turns Dangerous: Why Georgia Organizations Are Deploying Professional Weather Stations to Protect Lives
Georgia Weather Is Uniquely Varied — And Emergency Managers Know It
Georgia’s size and geography put it at the intersection of several distinct weather threats. The same state that experiences violent tornado outbreaks in its northern and central Piedmont region also absorbs the remnants of Gulf and Atlantic hurricanes moving inland across its agricultural heartland, faces flash flooding in fast-growing metro Atlanta, and manages wildfire risk in the pine forests and swampland of South Georgia. Few states see this range of hazards affect such different economic sectors — urban infrastructure, coastal tourism, and one of the nation’s largest agricultural economies — all within the same borders.
The record is well documented. The 1936 Gainesville tornado remains the deadliest in Georgia history, killing 203 people, including 70 workers at the Cooper Pants Factory. More recently, the March 2021 EF4 tornado that struck Newnan overnight tracked 66 miles and caused an estimated $100 million in damage. In September 2009, catastrophic rainfall produced 500-year flooding across metro Atlanta, killing 10 people, causing $500 million in damage, and triggering federal disaster declarations in 23 counties. In October 2018, Hurricane Michael became the first major hurricane to directly strike Georgia since the 1890s, causing more than $2.5 billion in agricultural losses alone across cotton, pecans, poultry, and timber. And in 2007, the Georgia Bay Complex Fire burned roughly 560,000 acres in and around the Okefenokee Swamp — the worst wildfire in Georgia and Florida history.
For the professionals responsible for protecting Georgia communities, the challenge is not awareness of these risks — it is having the right data, at the right location, at the right moment to act decisively. National Weather Service alerts are a critical layer of warning, but they are county-scale and often lag conditions on the ground by minutes that matter. What many Georgia organizations are discovering is that deploying a professional weather station on-site — a multi-sensor device providing real-time, facility-level readings — is the missing link between a regional forecast and a life-safety decision at a specific facility, field site, or outdoor venue.
Georgia Weather by the Numbers
1936 Gainesville tornado: 203 deaths — the deadliest tornado in Georgia history
March 2021 Newnan EF4 tornado: struck overnight, 66-mile path, ~$100 million in damage
September 2009 metro Atlanta floods: 10 deaths, $500 million in damage, 23 counties received federal disaster declarations
Hurricane Michael (2018): first major hurricane to directly hit Georgia since the 1890s; over $2.5 billion in agricultural losses 2007
Georgia Bay Complex Fire: roughly 560,000 acres burned around the Okefenokee Swamp — the worst wildfire in Georgia and Florida history
Georgia’s risk profile spans tornadoes, hurricanes, flash floods, wildfire, and extreme heat — often affecting agriculture, coastal, and urban sectors in the same season
What cyclonePORT Monitors — and Why Each Sensor Matters for Emergency Response
Wind Speed & Direction
Wind data is foundational to emergency management across threat types. During tornado events — including the overnight outbreaks that have repeatedly struck Georgia’s Piedmont region — rapid ground-level wind acceleration can provide critical seconds of additional warning. As Gulf and Atlantic hurricane remnants move inland across South Georgia’s farmland, sustained wind readings from cyclonePORT help agricultural operations, utilities, and emergency managers track storm intensity at a specific location as it weakens or reintensifies over land. In wildfire-prone areas near the Okefenokee Swamp and South Georgia’s pine forests, real-time wind speed and directional data determines burn direction, evacuation routes, and firefighter safety corridors.Lightning Detection
Georgia’s humid subtropical climate produces some of the most frequent summer thunderstorm activity in the Southeast, and lightning is particularly dangerous for outdoor events, athletic facilities, utility crews, and emergency staging areas. cyclonePORT’s lightning detection sensor identifies strike activity in real time, enabling organizations to implement lightning safety protocols — clearing outdoor areas, suspending operations, sheltering personnel — before a strike becomes a fatality. The Georgia High School Association (GHSA) specifically requires a fully functioning lightning detector at every outdoor athletic event, making this sensor a compliance-relevant tool as much as a life-safety one.Rain Gauge
Rainfall accumulation data from cyclonePORT is directly relevant to flash flood risk — the hazard responsible for the catastrophic September 2009 metro Atlanta floods. Georgia’s rapid urban development, particularly around Atlanta, has increased impervious surface coverage and runoff, making flash flooding an increasingly urban as well as rural hazard. A cyclonePORT rain gauge provides site-specific accumulation data that, combined with NWS flash flood guidance, gives emergency managers actionable information for road closures, evacuation decisions, and infrastructure protection. In hurricane season, rain gauge data also supports agricultural decision-making across Georgia’s cotton, pecan, and peanut growing regions, where rainfall totals directly affect crop loss assessments.Barometric Pressure
Rapidly dropping barometric pressure is one of the earliest measurable precursors to severe weather intensification. As tropical systems like Hurricane Michael and Hurricane Idalia have tracked into Georgia from the Gulf and Atlantic, pressure trends monitored by cyclonePORT at coastal and inland facilities give emergency managers and agricultural operations advance notice of an approaching or strengthening system. Inland, pressure drops associated with approaching squall lines and supercell thunderstorms give operations centers additional lead time to activate protocols before severe weather arrives.Humidity Sensor
Relative humidity intersects with emergency response in two critical ways in Georgia. At high temperatures, elevated humidity dramatically increases effective heat stress — the heat index — which determines the risk of heat-related illness for outdoor workers, first responders in full gear, and vulnerable populations, particularly in metro Atlanta’s urban heat island and across the state’s agricultural workforce. cyclonePORT’s humidity data, combined with temperature readings, provides the inputs needed to calculate real-time heat index values for specific locations. In wildfire contexts, low humidity combined with high winds creates the extreme fire weather conditions that the Georgia Forestry Commission uses to determine burn permit restrictions and fire danger ratings, particularly across South Georgia.Wet Bulb Globe Temperature (WBGT)
WBGT is the gold standard metric for evaluating heat stress risk in occupational and athletic settings. Unlike heat index, WBGT accounts for solar radiation load, making it significantly more accurate for outdoor environments where workers or student-athletes are exposed to direct sun. GHSA’s statewide Practice Policy for Heat and Humidity requires a scientifically approved WBGT instrument at every outdoor practice, with defined thresholds — including a mandatory halt to outdoor workouts once WBGT exceeds 92°F. Georgia school districts, municipalities, and private-sector employers with outdoor workforces increasingly rely on WBGT data to manage heat compliance obligations — obligations that carry real liability consequences when ignored.Georgia-Specific Use Cases: cyclonePORT in Emergency Management Practice
Tornado Preparedness in the Piedmont
Georgia’s northern and central Piedmont region, including metro Atlanta, sits within a broader Southeastern tornado corridor where storms can be fast-moving and, as the 2021 Newnan EF4 demonstrated, strike overnight with limited visual warning. For emergency managers overseeing outdoor facilities, large campuses, or distributed operations across this region, cyclonePORT provides site-level wind and pressure data that complements storm spotter networks and NWS warnings, including during overnight hours when human observation is limited.
When a tornado watch is issued, wind speed and pressure readings from cyclonePORT allow facility operators and incident managers to monitor real-time surface conditions and make timely shelter-in-place decisions. After a tornado event, cyclonePORT’s sensor logs provide documented weather data for after-action reviews and insurance documentation.
Case Application: School District Heat and Lightning Safety Compliance
GHSA bylaws require every outdoor athletic event to have a fully functioning lightning detector, and
require WBGT monitoring for all outdoor practices — with outdoor workouts prohibited once WBGT exceeds
92°F. A cyclonePORT station installed at an athletic facility provides both readings on-site simultaneously,
allowing athletic trainers and compliance officers to make objective, documented decisions about practice
modifications, event delays, and emergency cancellations. This protects student-athletes,
reduces institutional liability, and creates a defensible record of weather-based safety decisions.
Hurricane Remnants and Agricultural Protection
Georgia’s $73 billion agricultural economy — the state’s largest industry — is directly exposed to tropical weather moving inland from the Gulf and Atlantic. Hurricane Michael’s track through southwest Georgia in 2018 caused more than $2.5 billion in direct agricultural losses across cotton, pecans, vegetables, poultry, and timber; Hurricane Idalia caused further damage to South Georgia pecan orchards and row crops in 2023. For agricultural operations, county emergency managers, and utilities across South and Middle Georgia, cyclonePORT wind and rain data provides site-specific readings during a storm’s inland track that regional forecasts cannot supply at the level of an individual farm, facility, or substation.
Before landfall or inland arrival, cyclonePORT wind and pressure trends help operations teams determine the timing of protective actions — securing equipment, evacuating field workers, and staging recovery resources. After the storm, documented weather records support crop loss assessments, insurance claims, and FEMA and USDA disaster assistance applications.
Flash Flood Warning in Metro Atlanta and Beyond
The September 2009 flooding event that struck metro Atlanta remains one of Georgia’s costliest weather disasters, driven by rainfall totals that exceeded a 500-year event in some areas. Rapid urban development across the Atlanta metro has increased impervious surface coverage, meaning a given rainfall total now generates more runoff and faster-rising water than the same rainfall would have a generation ago. County emergency managers and municipal public works departments use rainfall accumulation data to make real-time decisions about road closures, storm drain capacity, and evacuation warnings.
A cyclonePORT station positioned at a flood-prone facility or low-lying community provides site-specific accumulation data that supports these decisions, giving emergency managers the early quantitative signal needed to act before floodwaters rise and before residents and infrastructure are at risk.
Wildfire Weather Monitoring in South Georgia
The 2007 Georgia Bay Complex Fire, which burned approximately 560,000 acres in and around the Okefenokee Swamp, remains the worst wildfire in Georgia and Florida history and demonstrated how quickly fire can outpace suppression efforts in the region’s pine forests and swampland when drought and wind align. The Georgia Forestry Commission manages burn permitting and wildfire suppression statewide, with particular emphasis on the fire-prone areas surrounding the Okefenokee National Wildlife Refuge.
Emergency managers and land management agencies use cyclonePORT wind speed, wind direction, and humidity data as real-time inputs for fire weather assessment. For facilities and communities near South Georgia’s wildland-urban interface zones, cyclonePORT provides situational awareness about wind shifts that affect evacuation route planning and incident command positioning.
Heat Emergency Response and Outdoor Worker Safety
Georgia’s urban centers — Atlanta, Savannah, Augusta, Macon, and Columbus — all experience meaningful urban heat island effects, while the state’s large agricultural and poultry-processing workforce faces direct heat exposure across South and Middle Georgia. For emergency managers overseeing cooling center operations, outdoor event safety, or utility and construction worker welfare programs, real-time heat index and WBGT data from cyclonePORT is a direct operational input.
Counties operating heat emergency programs use weather station data to trigger cooling center activations. Municipalities managing outdoor events use WBGT thresholds to determine whether to modify, delay, or cancel activities. Employers in construction, agriculture, logistics, and manufacturing use cyclonePORT data to support workplace heat safety practices under the federal OSHA General Duty Clause, which applies directly in Georgia.
Regulatory Compliance: Weather Monitoring as an Operational Obligation
For many Georgia organizations, the question is not simply whether cyclonePORT is useful — it is whether documented, on-site weather monitoring supports obligations that already exist. The regulatory landscape increasingly suggests that organizations operating outdoor facilities or managing outdoor workforces have responsibilities that on-site monitoring directly supports.
Federal OSHA and Workplace Heat Safety
Unlike some neighboring states, Georgia does not operate its own OSHA-approved state plan — private-sector employers in Georgia fall under direct federal OSHA jurisdiction. While federal OSHA heat illness prevention rulemaking remains in development, OSHA’s General Duty Clause has been applied in heat-related fatality investigations where employers failed to monitor environmental conditions. Having a cyclonePORT station with WBGT measurement creates a documented, objective record of conditions at a worksite — a record that supports both proactive decision-making and post-incident compliance defense.
GHSA Athletic Safety Standards
GHSA’s statewide Practice Policy for Heat and Humidity requires every member school to maintain a written heat policy using WBGT or an approved alternative, with mandatory activity restrictions once WBGT crosses defined thresholds and a full stop to outdoor workouts above 92°F. GHSA rules also require a functioning lightning detector at every outdoor athletic event. School districts that document weather-based activity decisions using on-site station data are better positioned to demonstrate policy compliance than those relying on a single handheld reading or regional forecast estimates.
Georgia EPD and Industrial Facilities
Industrial facilities operating under Georgia Environmental Protection Division (EPD) air quality permits routinely need meteorological data to support air dispersion modeling and permit applications — EPD itself maintains and distributes processed meteorological datasets for this purpose. Facilities with their own on-site cyclonePORT station gain continuous, site-specific meteorological data that can support both compliance documentation and emergency response planning tied to their air permit obligations.
FEMA and GEMA/HS Documentation
Following a federally declared disaster in Georgia, documented weather data from an on-site station strengthens FEMA Public Assistance and Hazard Mitigation Grant Program applications. The Georgia Emergency Management and Homeland Security Agency (GEMA/HS), which coordinates the state’s preparedness, response, and recovery efforts under the Georgia Emergency Management Act of 1981, works closely with county-level emergency management agencies that benefit from having a timestamped sensor record of the weather event that triggered response costs or facility damage.
Built for Severe Weather
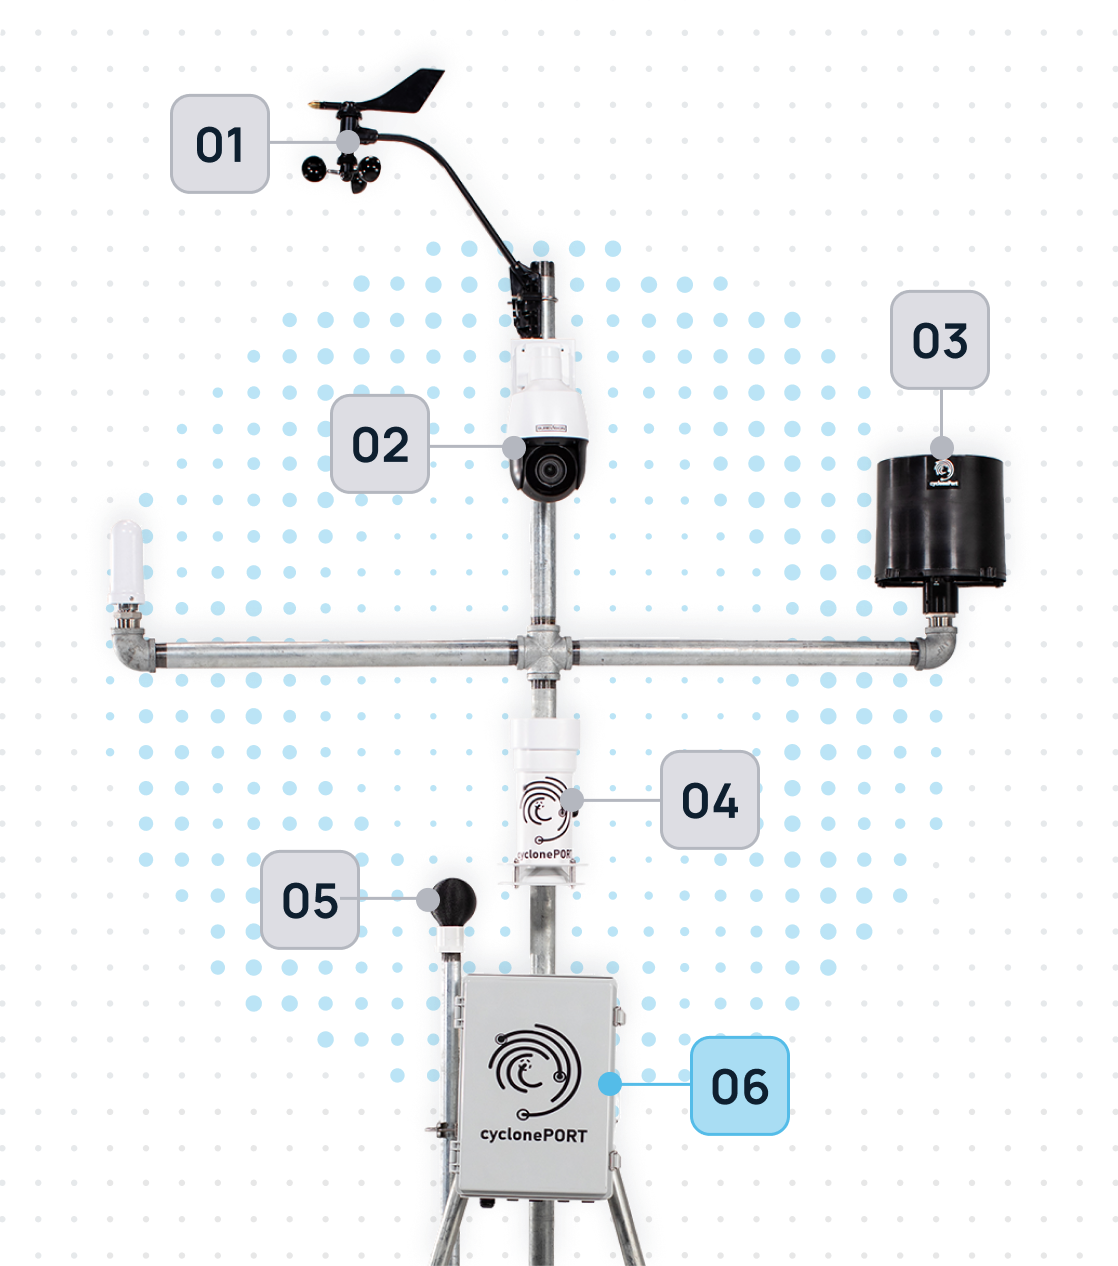
The Pulse of the Sky
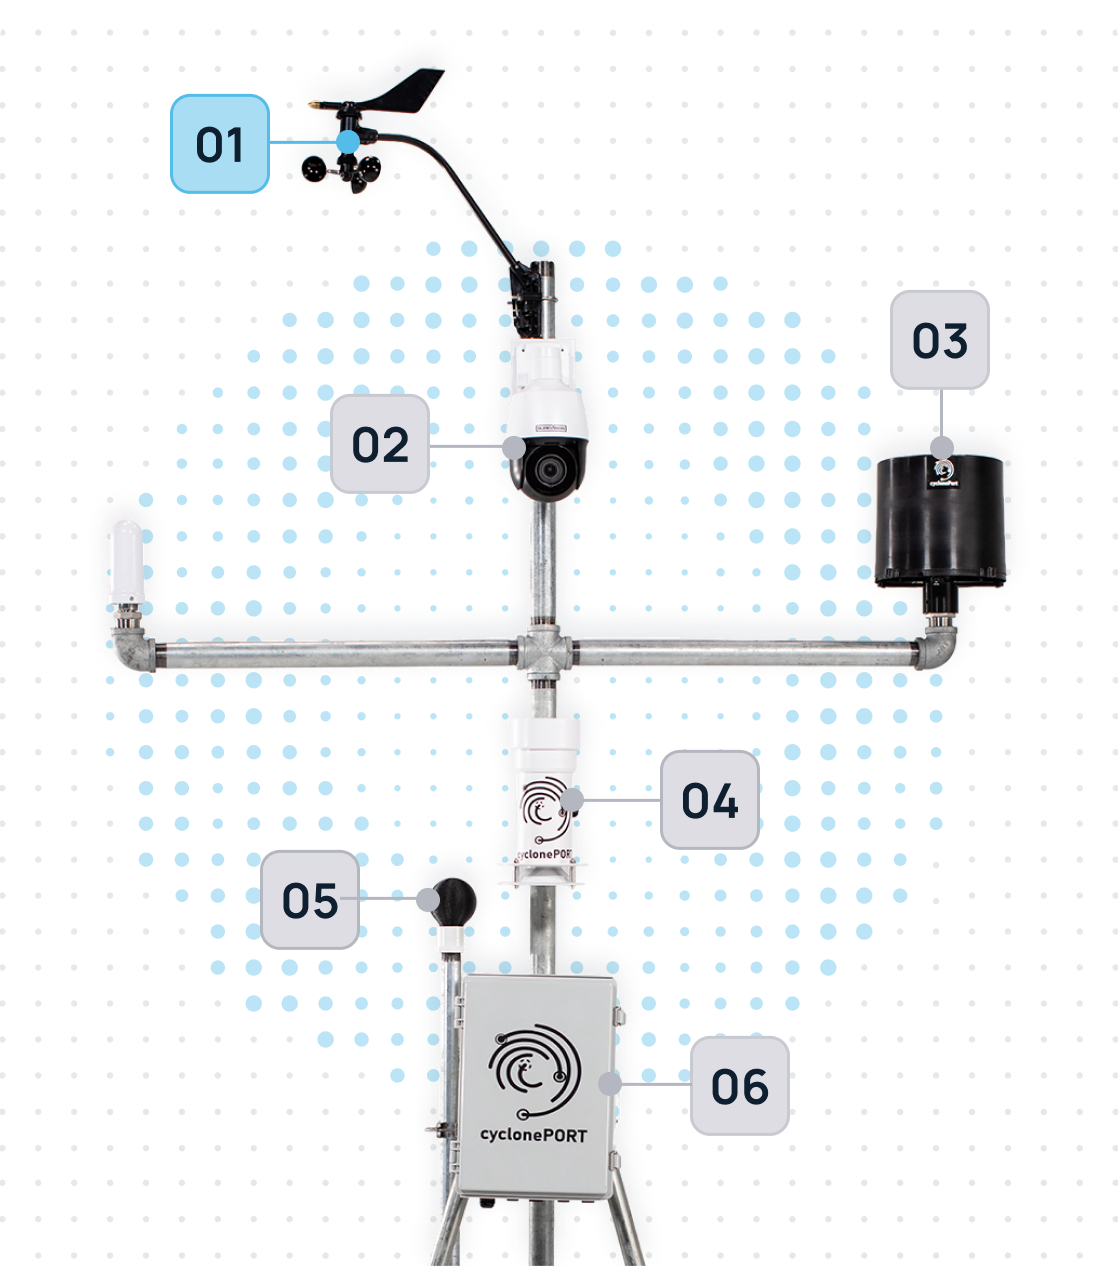
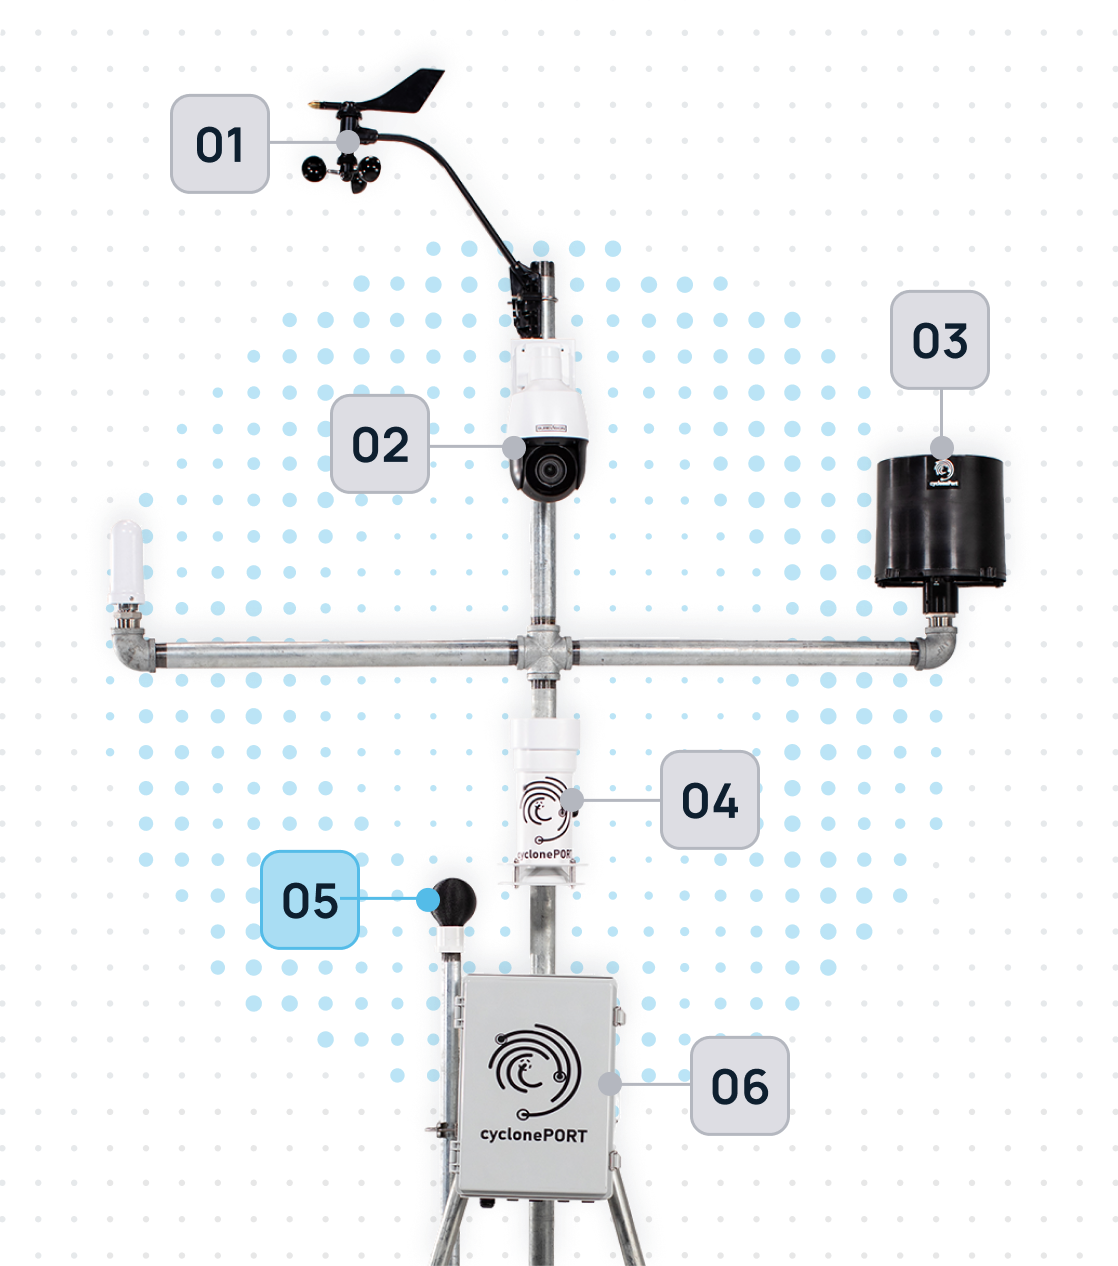
The anemometer is the “nervous system” of our weather stations. Moving beyond old-fashioned mechanical cups, our hardware utilizes ultrasonic sensor arrays to measure the velocity and direction of the wind. By calculating the time it takes for sound pulses to travel between sensors, it provides a lag-free, high-definition map of air movement.
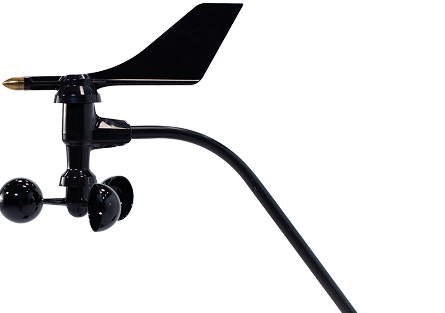
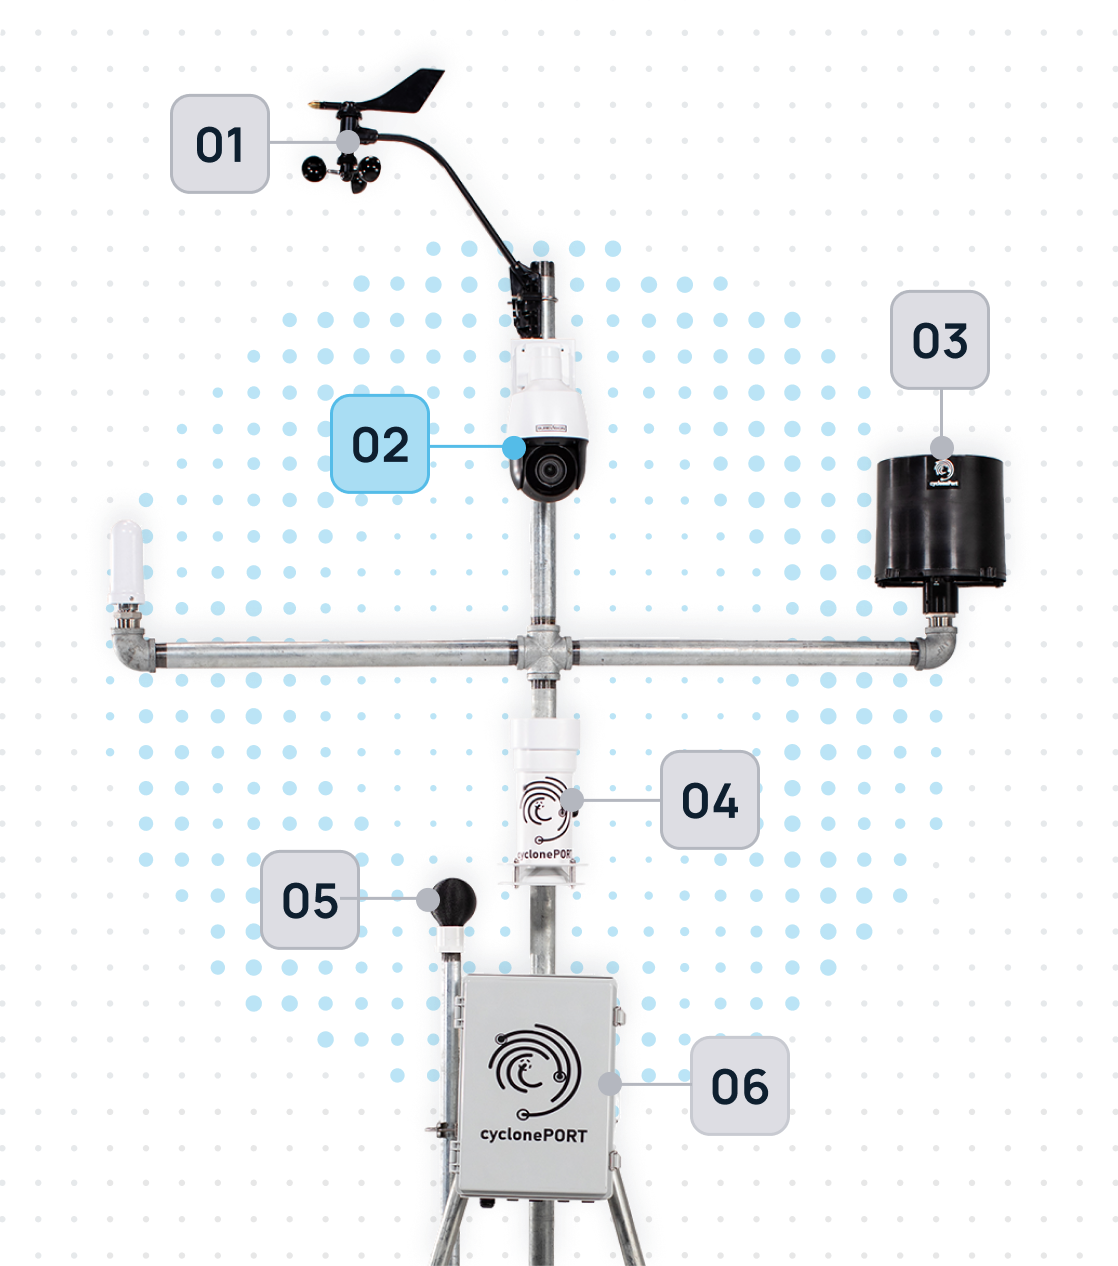
The PTZ Observation Unit
Our PTZ units are ruggedized optical sensors designed to withstand the very conditions they are monitoring. These aren’t just for recording video; they serve as a critical layer of visual ground-truthing. When our sensors detect a change in wind speed or pressure, the PTZ camera can automatically swivel to the point of interest—allowing us to see the formation of wall clouds, debris, or precipitation in real-time.
The lens moves vertically, allowing for a look at both high-altitude cloud formations and ground-level impacts
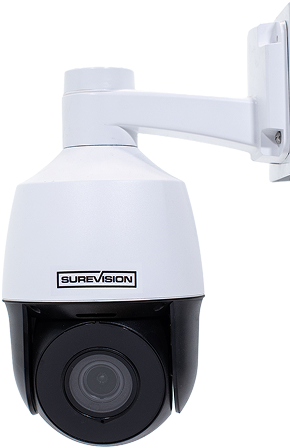
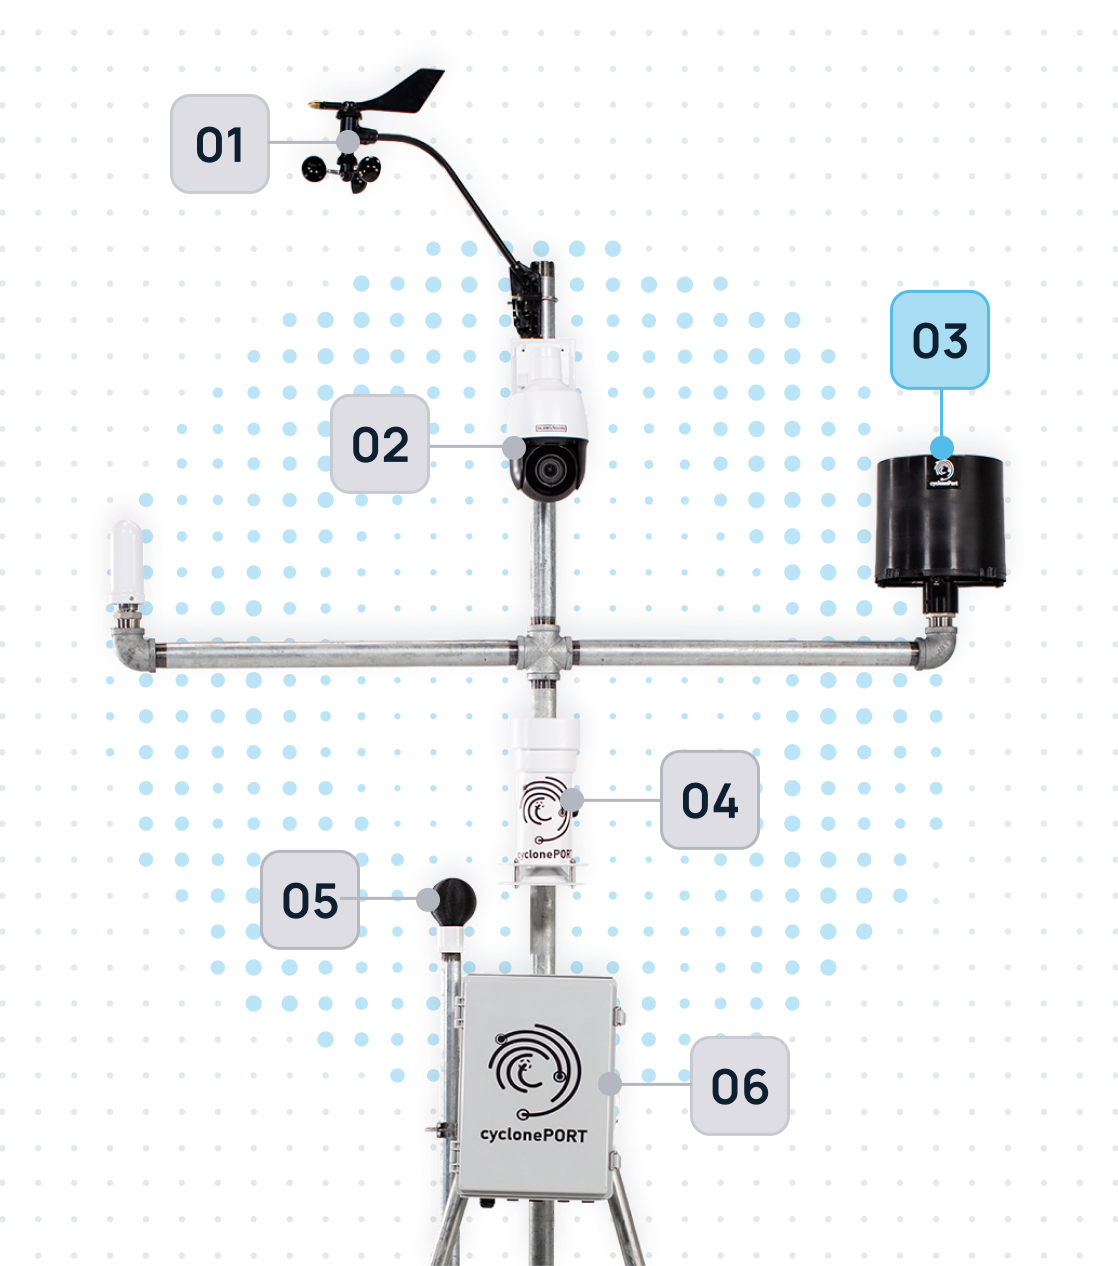
Liquid Precision: The Smart Rain Gauge
The rain gauge is the primary component for measuring precipitation intensity and accumulation. Our systems typically utilize “Tipping Bucket” or “Optical” technology to provide high-resolution data. As droplets enter the collector, the sensor logs the volume in real-time, allowing our AI to calculate rainfall rates per minute.
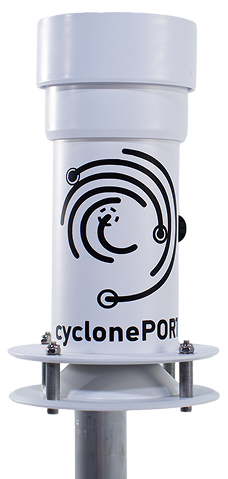
Resilience by Design: The Primary Sensor Housing
The Primary Sensor Housing is the ruggedized enclosure that integrates and protects the suite of meteorological instruments. It isn’t just a box; it is a precision-engineered environment. Designed with aerodynamic stability and thermal regulation, it ensures that internal components—like barometers, data loggers, and transmission hardware—stay dry, cool, and connected even in hurricane-force winds or sub-zero blizzards.
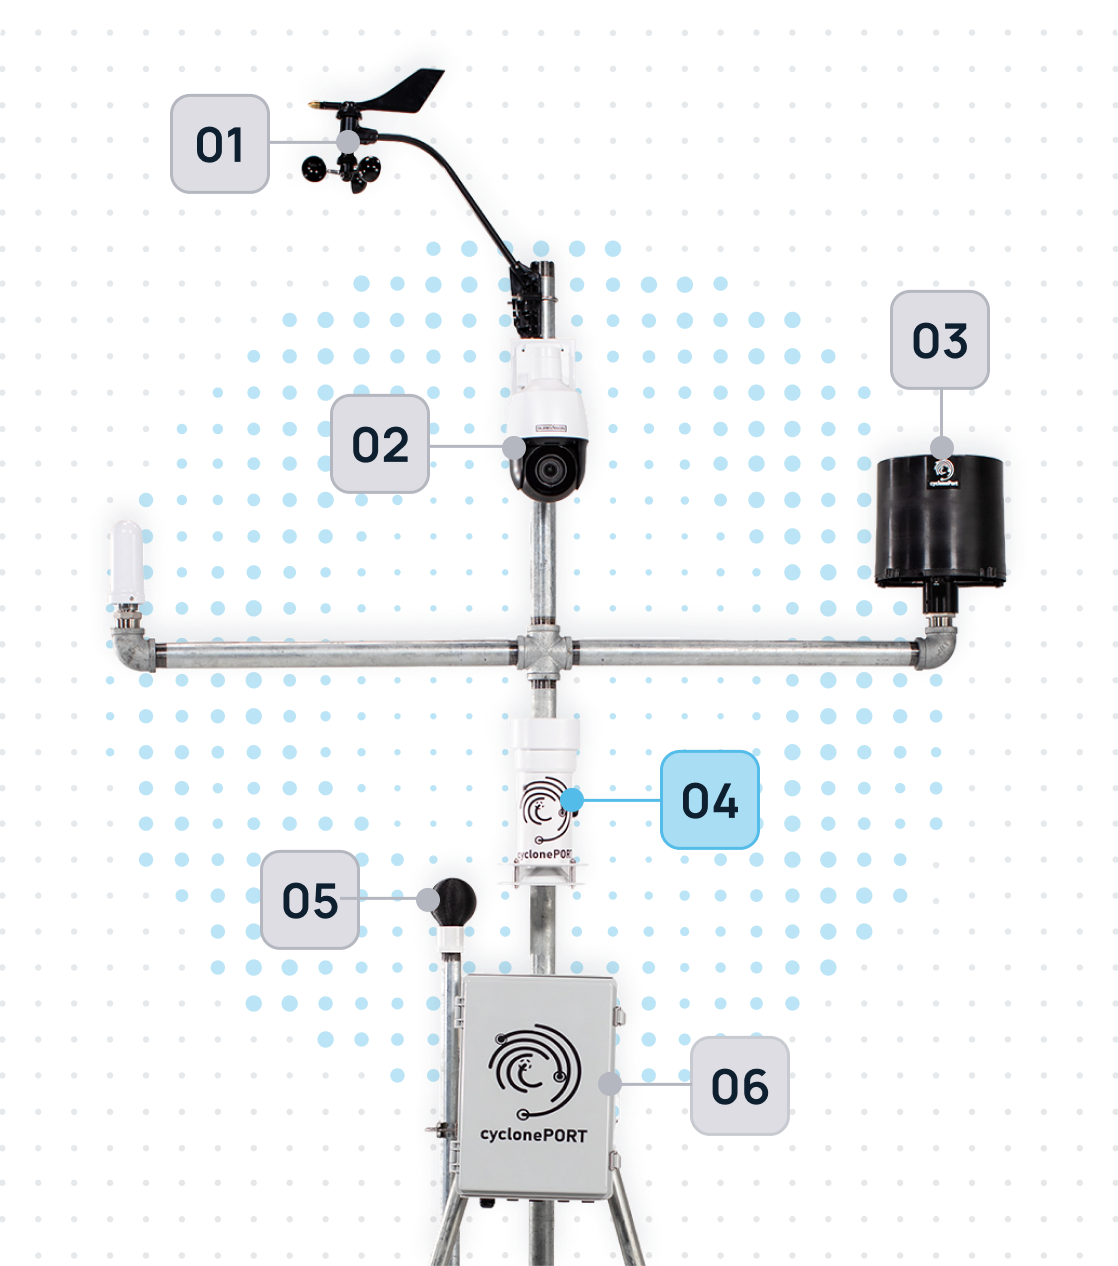
Human-Centric Heat Intelligence
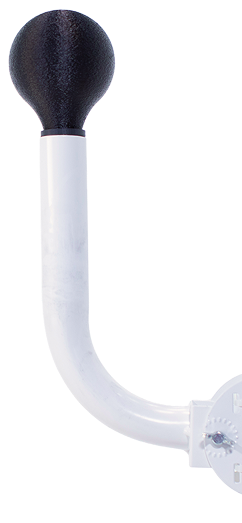
The Wet Bulb Globe is the “biometric” sensor of our weather stations. It doesn’t just measure ambient air; it accounts for the three-way punch of temperature, humidity, and solar radiation. By simulating how a human being absorbs heat while sweating in direct sunlight, it provides the Wet Bulb Globe Temperature (WBGT)—the most accurate metric for predicting heat exhaustion and sunstroke.
For companies managing outdoor crews, sports events, or high-load data centers, this sensor is the definitive “go/no-go” signal for safety.
The Intelligence Engine: CyclonePORT Hub
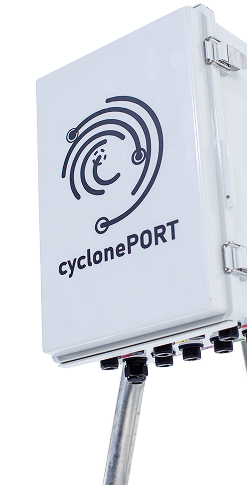
The CyclonePORT Hub is the central nervous system of our weather monitoring architecture. It serves as the high-speed bridge between raw environmental data and actionable cloud intelligence. While our sensors are busy “feeling” the storm, the Hub is busy translating those signals, encrypting the data, and ensuring it reaches our forecasting models in milliseconds—even when local power grids or traditional networks fail.
It is designed for “Edge Computing,” meaning it processes critical data locally to provide instant alerts before the information even hits the cloud.
Deployment Profiles: Where Georgia Organizations Are Installing cyclonePORT
cyclonePORT is designed for professional and commercial use across a wide range of organizational settings. Georgia emergency managers are deploying cyclonePORT weather stations in configurations that match their specific risk profiles and operational requirements.
| Organization Type | Primary cyclonePORT Use Cases |
| County Emergency Management Agencies | Real-time surface weather for EOC situational awareness; overnight tornado and hurricane-remnant monitoring; documentation for disaster declarations and GEMA/HS reporting |
| K–12 Education & School Districts | WBGT and lightning detection for outdoor athletics under GHSA rules; heat emergency protocol triggers; documented compliance records |
| Municipal Parks & Recreation | Lightning detection for aquatic centers and athletic fields; heat index monitoring for outdoor events; rainfall data for park and greenway closures |
| Electric Utilities & TVA-Connected Providers | Wind and pressure monitoring at substations and generation facilities; hurricane-remnant and severe storm outage-risk forecasting; storm documentation for regulatory and insurance purposes |
| Construction & Infrastructure Contractors | Wind and rain data for cotton, pecan, peanut, and poultry operations during hurricane season; heat safety for field and processing workers; crop-loss documentation for insurance and disaster assistance |
| Coastal & Port Operations | Heat safety documentation supporting federal OSHA General Duty Clause compliance; lightning safety for elevated work; wind monitoring for crane and lift operations |
| Manufacturing & Logistics Operations | Site weather monitoring for distribution centers and plants across Georgia’s freight corridors; heat compliance for warehouse and yard crews; wind and lightning data for outdoor loading operations |
Integration with Georgia Emergency Management Systems
cyclonePORT is designed to complement, not replace, existing emergency management infrastructure. Its sensor data integrates with organizational decision-making workflows and can serve as a ground-truth input alongside NWS products and the tools used by the Georgia Emergency Management and Homeland Security Agency (GEMA/HS), which coordinates the state’s preparedness, response, and recovery efforts as part of the Office of the Governor.
Compatibility with NWS Alert Workflows
National Weather Service offices serving Georgia — including Peachtree City, Charleston, and Jacksonville — issue Tornado Warnings, Flash Flood Warnings, Hurricane Warnings, and Extreme Heat Advisories that establish the regional threat context. cyclonePORT provides the site-specific surface data that gives those alerts operational meaning for a particular location. When an NWS Flash Flood Warning is issued for a metro Atlanta county, a cyclonePORT rain gauge at a specific facility tells the operator whether local accumulation is approaching dangerous thresholds at that site, right now.
Backup Monitoring During Grid and Communication Events
Hurricane Michael and the 2009 metro Atlanta floods both demonstrated that Georgia emergency managers must plan for scenarios where standard communication and power infrastructure is degraded across large geographic areas. cyclonePORT hardware is designed for resilient deployment, providing organizations with a monitoring capability that does not depend on the continuity of broader infrastructure systems.
Documentation for After-Action Reports and Grant Applications
Timestamped sensor logs from cyclonePORT provide the kind of granular, location-specific weather record that supports after-action reviews, insurance claims, FEMA documentation, and grant narrative development. For Georgia county emergency managers writing Hazard Mitigation Grant Program applications, documented local weather event data strengthens the case for infrastructure investment.
Frequently Asked Questions: cyclonePORT for Georgia Emergency Management
Which weather threats in Georgia are most relevant to cyclonePORT’s sensor suite?
How does cyclonePORT fit into an existing emergency management weather monitoring workflow?
Does our organization have a regulatory obligation to monitor on-site weather conditions?
Can cyclonePORT support a multi-site or distributed deployment across our facilities?
How does cyclonePORT data integrate with existing EOC tools and notification systems?
What are the data retention capabilities for weather records — for insurance, compliance, or grant documentation?
Conclusion: Ground Truth for Georgia Emergency Management
Georgia emergency management professionals face one of the most economically varied threat environments in the country — protecting urban infrastructure, coastal and port operations, and one of the nation’s largest agricultural economies, often from the same storm system. The tools available to support their work have never been more capable. cyclonePORT is a professional weather station that represents a practical, deployable extension of the warning and monitoring ecosystem, giving organizations the ground-level data they need to make faster, more defensible decisions when weather turns dangerous.
From the overnight tornado risk of the Piedmont to the hurricane-remnant exposure of South Georgia farmland, from the flash flood vulnerability of metro Atlanta to the wildfire risk surrounding the Okefenokee, the need for real-time, on-site weather intelligence is not abstract. It is operational. It is happening right now, in the communities and facilities that Georgia emergency managers are responsible for protecting.
Build the Hyper-Local Weather Intelligence
Your Texas EOC Needs
Contact the SDS Weather team to learn more about cyclonePORT, discuss your organization’s specific weather monitoring needs, and explore deployment options for your facilities and operations.
cycloneport.com/contact | info@cycloneport.com | 844-737-9328