Live Weather Monitoring Station
Real-time weather data, HD live video, and radar in a single platform — cyclonePort is the only weather surveillance system that combines a professional multi-sensor weather station, PTZ live-streaming camera, and the RadarOmega radar app into one integrated solution for emergency management, campus safety, athletics, construction, broadcast media, and public safety operations.
Contents
01 What Is a Live Weather Monitoring Station?
02 Why Live, On-Site Data Beats Weather Apps and Radar Alone
03 The cyclonePort Sensor Suite — What Is Measured and Why
04 Live Streaming Camera — The Feature No Competitor Offers
05 RadarOmega Integration — Sensor Data + Live Video + Radar in One App
06 Weather Monitoring Equipment — How It All Works Together
07 What ‘Live Weather Radar’ Actually Means vs. What You Need On-Site
08 Operational Applications — Who Uses Live Weather Monitoring Stations
09 Deployment, Installation & Network Management
10 System Specifications
11 Frequently Asked Questions

- Every 5 seconds
- HD PTZ Live Stream
- 8+ parameters
01 What Is a Live Weather Monitoring Station?
A live weather monitoring station is a permanent, facility-deployed system of calibrated sensors that continuously measure atmospheric conditions — temperature, humidity, wind speed and direction, barometric pressure, rainfall, lightning, and heat stress — and transmit that data in real time to a cloud platform accessible from any device. Unlike a weather app that interpolates data from an airport miles away, a live weather monitoring station measures conditions at your exact location and updates continuously.
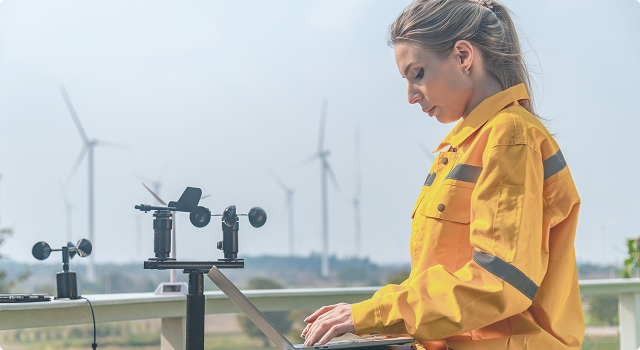
cyclonePort takes this further: every station includes a PTZ (pan-tilt-zoom) HD camera that live-streams visual conditions alongside the sensor data. Operators see what the wind is doing to the trees, whether the sky to the west is darkening, whether lightning is visible on the horizon — all simultaneously with the second-by-second sensor readings. No other commercial weather monitoring system combines physical sensor measurement, live HD video, and integration with a professional radar app in a single deployable package.
The core distinction: surveillance, not just monitoring Most weather station platforms report what the instruments measure. cyclonePort adds what a trained observer standing at the station would see — live HD video through a side-mounted pan-tilt-zoom camera, viewable through the cyclonePORT Enterprise (Nexus) platform that hardware owners use to manage their network. The combination of sensor data and visual context is what transforms weather monitoring into weather surveillance: the ability to see conditions, not just read numbers, and the ability to physically show what’s happening to people who need to act. |
cyclonePort stations are deployed across schools, athletics facilities, university campuses, municipal emergency management offices, broadcast television stations, construction sites, public safety agencies, and utility operations centers. cyclonePort hardware is offered to enterprise clients, who manage their stations and networks through the cyclonePORT Enterprise platform. Sensor data and live camera feeds are accessible to authorized users within the customer’s organization, while NEXRAD Doppler radar — the same radar that powers RadarOmega’s 261,000+ subscribers — provides the wide-area picture that surrounds every deployed station.
02 Why Live, On-Site Data Beats Weather Apps and Radar Alone
The central limitation of weather apps, phone-based forecasts, and even regional Doppler radar is geography: they describe conditions somewhere near you, not at your specific location. This distinction is operationally critical when the difference between conditions at the airport and conditions at your practice field or jobsite is what determines whether people are safe.
The Geographic Gap in Weather App Data
Weather apps rely on output from numerical forecast models that process data from ground stations, satellites, and radar systems — then smooth and interpolate the results across grids that can span 10–20 miles per cell. A weather app showing 82°F and 65% humidity for your city may be accurate for the airport, or wherever the nearest NWS station is located. But conditions at your facility — on an asphalt-surrounded athletic field with south-facing bleachers reflecting solar radiation — may be 88°F with 70% humidity and a heat index of 100°F. Other apps cannot know this. The cyclonePort station at your facility measures it directly.
The gap that matters most is often 5–10°F Research consistently documents that urban heat island effects, surface cover differences, and local topography can produce temperature differences of 5–10°F within a single county — sometimes within a single mile. At 88°F with 70% relative humidity, the heat index is approximately 100°F (Danger category). At 83°F with the same humidity, it is approximately 88°F (Caution category). A facility relying on a regional weather app that reads 83°F may be in a Danger zone by its own on-site conditions — and its safety program will not reflect that without on-site measurement. WBGT (Wet Bulb Globe Temperature) is the gold standard for heat stress decisions and is supported as an optional sensor for organizations that need to act on more than heat index alone.What Doppler Radar Measures — and What It Cannot |
What Doppler Radar Measures — and What It Cannot
Doppler radar is a powerful tool for visualizing precipitation location, storm movement, and storm intensity across a wide area. The NEXRAD network of 160 radar sites across the United States provides the data that powers weather apps, NWS forecasts, and broadcast meteorology. RadarOmega provides access to this high-resolution NEXRAD data.
But radar has fundamental limitations for facility-level safety decisions:
- Radar measures precipitation aloft — not at ground level. Radar beams travel at angles that increase with distance from the radar site. At 100 miles from the radar, the beam may be measuring precipitation at several thousand feet of altitude — which may or may not reach the ground. What you see on radar and what you see on the ground can often be different.
- Radar cannot measure temperature, humidity, heat index, or wind chill. These variables that drive heat and cold safety protocols require surface sensors. Radar contributes nothing to these calculations.
- Radar cannot measure surface wind speed and direction. Doppler velocity products measure radial wind velocity at beam height, not the surface wind conditions that affect crane operations, field conditions, spray drift, or smoke plume direction at your location.
- Radar cannot measure lightning ground strike location with precision. Lightning detection networks provide real-time ground strike location and proximity — fundamentally different from the radar reflectivity that indicates a storm’s presence.
Radar and on-site stations are complements, not substitutes A complete live weather intelligence picture requires both: NEXRAD radar to see approaching weather systems and track storm movement across a region, AND on-site sensors to measure the actual atmospheric conditions at your facility in real time. cyclonePort customers get both: station sensor data and live video from cyclonePORT hardware, displayed in the cyclonePORT Enterprise platform alongside the high-resolution NEXRAD radar that RadarOmega is known for. |
03 The cyclonePort Sensor Suite — What Is Measured and Why
A cyclonePort weather monitoring station measures the full suite of atmospheric variables that operational decisions based on safety require — all updated continuously and transmitted in real time to the cyclonePORT Enterprise platform.
Sensor / Parameter | What It Measures and Why It Matters |
|---|---|
Temperature (Dry Bulb) | Ambient air temperature in °F and °C, updated every five seconds. Foundation for heat index, wind chill, dew point, and all derived thermal comfort metrics. Measured inside a radiation-shielded housing. |
Relative Humidity | Atmospheric moisture percentage. Combined with temperature to calculate heat index and dew point in real time. Critical for evaporative cooling effectiveness assessment. |
Heat Index | NWS Rothfusz formula applied continuously to temperature and humidity readings. Displayed with NWS risk category (Caution / Extreme Caution / Danger / Extreme Danger). WBGT is recommended over heat index for activity-modification decisions. |
Wind Speed | Sustained wind speed and peak gusts, updated every 5 seconds. Ultrasonic measurement preferred (no moving parts, no icing failure, sub-0.2-second response). Used for wind chill, spray drift assessment, crane operation safety, and detecting near-surface wind shifts. |
Wind Direction | Continuous 0–360° vector-averaged compass bearing, referenced to true geographic north. Combined with speed for complete wind vector. Used for smoke and chemical plume tracking, fire spread direction, frontal passage detection. |
Wind Chill | NWS 2001 formula applied continuously when temperature ≤50°F and wind speed >3 mph. Displayed with frostbite risk category. |
Barometric Pressure | Absolute and sea-level-equivalent pressure, updated every 5 seconds. Trend analysis (rising/falling rate) provided for various time frames. The earliest automated storm approach signal — detectable before rain, before lightning, before visible sky change. |
Rainfall (Rain Gauge) | Tipping-bucket precipitation measurement with sub-millimeter resolution. Reports both rate and cumulative totals. Combined with wind direction for complete storm characterization and event documentation. |
Lightning Detection | Real-time lightning strike detection with proximity alerting. Strike distance reported continuously. Configurable lightning monitoring notifications are available to cyclonePORT Enterprise users; alerts incorporate strikes detected by the cyclonePORT network. |
WBGT (Wet Bulb Globe Temperature) | Optional. The industry-standard heat stress metric used by OSHA, NIOSH, NCAA, NFHS, GHSA, and the U.S. military. Measures actual thermal load on an outdoor person including solar radiation, wet bulb, and dry bulb. Custom WBGT thresholds can be configured per organization. See cyclonePort WBGT page. |
Dew Point | Calculated continuously from temperature and humidity. Contributes towards heat index calculations. |
Solar Radiation / UV | Optional. Quantifies incoming solar energy and UV index. Input for evapotranspiration calculations, WBGT estimation, and infrastructure performance modeling. |
Quick-reference sensor accuracy at a glance:
Sensor | Accuracy / Key Specification |
|---|---|
Temperature / Humidity | ±0.2°C temperature accuracy; ±2–3% RH accuracy. Radiation-shielded housing prevents solar bias errors. |
Barometric Pressure | 0.1 hPa precision — sufficient to detect the 3–6 hPa/3-hour pressure falls that signal a significant approaching storm. |
Ultrasonic Wind Sensor | No moving parts. Reliable in icing conditions where mechanical cup-and-vane sensors fail. Sub-0.2-second response to gusts. |
Rain Gauge | 0.01 inch (0.2 mm) resolution tipping-bucket. Optional heated version for frozen precipitation environments. |
Lightning Sensor | Real-time strike detection and distance mapping. Strike proximity reported in real time. |
04 Live Streaming Camera — The Feature No Competitor Offers
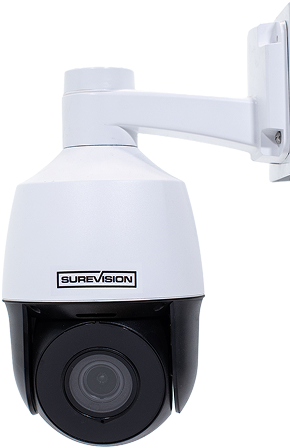
Every cyclonePort station ships with an integrated HD PTZ (pan-tilt-zoom) camera that live-streams visual conditions from the station location — viewable in real time through the cyclonePORT Enterprise platform on any phone, tablet, or desktop browser. This is the capability that sets cyclonePort apart from every other commercial weather monitoring system: you do not just read sensor numbers, you can physically see the conditions and show them to the people who need to act on them.
Why visual context matters
Numbers on a screen are easy to dismiss. A live image of flood water rising at the bridge, a wall cloud building to the southwest, or a lightning strike reflected off the field is not. Across the schools, emergency management offices, and athletics programs that deploy cyclonePort, the consistent operational lesson is the same: people respond faster and more decisively to a visual threat than to a number on a dashboard. The camera is a communication tool for emergency response, not a substitute for sensor data — it amplifies the urgency that the sensors and radar are already reporting.
What PTZ Means Operationally
PTZ — pan, tilt, zoom — describes a side-mounted camera that can be remotely controlled to:
- Pan: Rotate horizontally through approximately 270° (side-mounted geometry constrains the rear arc) — scanning the horizon for storm development, checking different compass directions for approaching weather.
- Tilt: Angle vertically to survey a field or construction site, monitor rooftop conditions, or look down toward ground level. The mount geometry limits direct overhead view, so the camera can tilt downward but not fully upward to point straight at the sky
- Zoom: Optical zoom capability that brings distant objects into sharper detail — the anvil of a developing thunderstorm, a flagpole to visually confirm wind direction, a construction crane’s load behavior in gusting conditions.
Camera control is administered through the cyclonePORT Enterprise platform. The ability to operate cameras is granted on a per-account basis: the customer organization designates which authorized accounts can control PTZ functions. Camera operator designation is configured through the cyclonePORT Nexus organization-management layer. The general public RadarOmega audience does not control cyclonePORT cameras.
Camera stream features |
Live HD Stream: Accessible to authorized accounts in the cyclonePORT Enterprise platform on any iOS, Android, Windows, Mac, or Linux device. Low-latency encoding for real-time situational awareness. |
Time-lapse generation: Automatic time-lapse compilation of camera footage over user-defined intervals — useful for reviewing the progression of a storm event, documenting cloud development, or providing post-event visual evidence. |
Clip saving: Save specific moments in the camera archive for rapid retrieval during after-action reviews, insurance documentation, or incident investigations. |
Access control: Camera access is granted to cyclonePORT hardware owners and the individual users they authorize within their organization. Public-facing distribution of a camera feed (for example, to a broadcast partner) may be possible via RTMP links in some configurations. |
What the Camera Provides That Sensors Cannot
Sensors measure. Cameras communicate. Not every operational call is improved by replacing a sensor reading with a video feed — for heat stress decisions, for example, you should always trust the WBGT sensor, never a visual judgment of the sky. The camera’s value is in three things sensors cannot do:
- Driving action through visible threat. When a school administrator, emergency manager, or job-site supervisor needs to convince staff, athletes, or workers that conditions are serious enough to act on, a live image of the threat is the most persuasive tool available. Numbers prove the threat exists; the camera makes it real.
- Post-event documentation. After an impactful severe weather event — hail, high wind, flooding — the camera provides the visual record of conditions at the facility, timestamped and archived. Insurance claims, after-action reviews, and incident documentation all benefit from photographic evidence rather than sensor logs alone.
- Situational context for the data on screen. A radar cell approaching from the southwest is information; a camera panned to the southwest showing the leading edge of that cell is the same information made undeniable. The camera reinforces what the data is already saying — it does not override the data.
NWS ground-truth confirmation — real-world deployment When Stanton County Emergency Management (Nebraska) deployed a cyclonePort station, the county’s director noted that the live video enhances situational awareness for the National Weather Service by providing reliable local data and live video that can assist in forecasting and warning decisions. This is the operational value of combining sensor data with live streaming: the NWS gains a ground-truth data point — both measured and visual — at a specific location that their remote radar and model data cannot replicate. |
05 RadarOmega Integration — Sensor Data + Live Video + Radar in One App
cyclonePort hardware customers operate their stations through cyclonePORT Enterprise, which is built by the team behind RadarOmega — the professional weather radar platform trusted by 261,000+ subscribers, used by broadcast meteorologists, university programs, emergency managers, and professional storm chasers. cyclonePORT Enterprise is the main interface for hardware owners and is powered by RadarOmega data. Together, the two platforms give customers the leading professional radar tool plus their own on-site sensor and camera network.
What the Platform Provides
- High-resolution NEXRAD Doppler radar: Single-site and multi-site radar products at the resolution and update frequency that professionals require. Reflectivity, storm relative velocity, dual-polarization products, and 3D volumetric radar — available with RadarOmega.
- cyclonePort station map layer: Connected cyclonePort stations appear on the map. The station marker indicates a unit’s location; opening a cyclonePort display surfaces the unit’s current sensor readings and the live camera feed for authorized accounts.
- Lightning detection and animation: Real-time lightning strike location and animation. Lightning monitoring notifications — including strikes detected by the cyclonePORT network — are available to cyclonePORT Enterprise users with appropriate access.
- NWS warning overlays in RadarOmega: Real-time storm-based warnings, watches, and advisories displayed on the radar map in RadarOmega. (Note: the cyclonePORT Enterprise display is focused on the customer’s own units; active NWS warnings are surfaced in RadarOmega rather than within the cyclonePORT display itself. WBGT threshold breaches are surfaced in the cyclonePORT display.)
- Historical access: Sensor logs and camera footage are available within the cyclonePORT Enterprise platform to authorized users. Sensor data export is not available at this time.
Two-platform architecture, one workflow. A customer’s typical workflow runs in parallel: the radar map and NWS warnings live in RadarOmega; the customer’s own cyclonePort sensors, alerts, and cameras live in cyclonePORT Enterprise. Both platforms are the work of the same team, share the same underlying data infrastructure, and are designed to be used together — not as competing surfaces. |
Notification model — what we send and what we don’t
A common point of confusion deserves a clear answer:
- Lightning monitoring notifications are available to cyclonePORT Enterprise users, configurable per organization, and incorporate strikes detected by the cyclonePORT network.
- WBGT alerts can be configured against custom thresholds; notification capabilities for WBGT thresholds are not available at this time. [FLAG: cyops verification]
- General sensor-threshold notifications (e.g., heat index, wind chill, wind speed) are not currently sent as push or SMS alerts. Users monitor those values directly in the cyclonePORT Enterprise display.
- Email alerts are not part of the notification model.
- These notification capabilities apply to cyclonePORT Enterprise customers only — not to general RadarOmega users.
06 Weather Monitoring Equipment — How It All Works Together
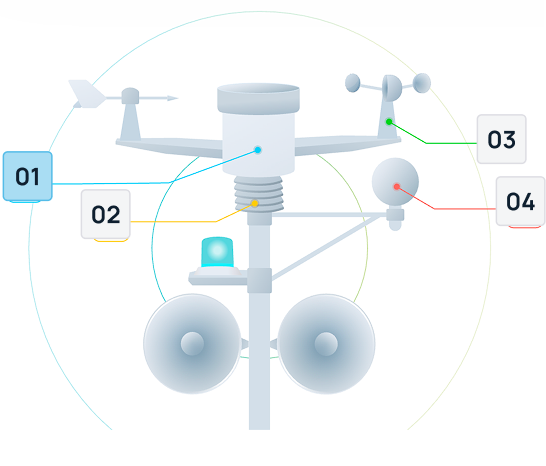
A cyclonePort weather monitoring station is an integrated system, not a collection of separate devices. Understanding how the components work together clarifies why the system provides operationally reliable data and why individual components or consumer-grade alternatives fall short.
Physical Components
Component | Function and Specification |
|---|---|
Sensor housing | Custom-built enclosure housing the temperature, humidity, dew point, and barometric pressure sensors. Multi-plate radiation shield with passive ventilation geometry maintains sensor accuracy by preventing solar heating of the elements. |
Wind sensor (anemometer + vane) | Ultrasonic preferred: measures wind speed and direction with no moving parts — no ice-induced bearing failures, no wear, sub-0.2-second gust response. Mechanical cup-and-vane alternative for power-constrained remote deployments. |
Rain gauge | Tipping-bucket design measuring rainfall rate and cumulative totals with sub-millimeter resolution. |
Lightning detection module | On-board or networked lightning detection with real-time strike distance reporting. |
PTZ IP camera(s) | High-definition, side-mounted pan-tilt-zoom camera. WiFi or direct Ethernet connection. Static IP configuration available. PTZ control through the cyclonePORT Enterprise platform for authorized accounts. |
Data logger / onboard processor | Collects all sensor readings every 5 seconds, applies calibration coefficients and quality control checks, computes derived metrics (heat index, wind chill, dew point, WBGT), and formats data for transmission. |
Connectivity | Cellular (4G LTE), WiFi, or Ethernet transmission to the cyclonePORT cloud platform. Remote toolkit for system maintenance and control from any location. |
Power | AC mains (standard) or solar with battery backup for remote deployments. Power consumption optimized for continuous operation. |
Data Flow — From Sensor to Dashboard
Every 5 seconds: sensors sample their respective physical parameters and output calibrated readings to the onboard data logger. The logger applies quality control checks — flagging step changes exceeding sensor response physics, out-of-range values, or communication faults — and computes derived metrics. Data is formatted and transmitted to the cyclonePORT cloud platform via the station’s connectivity link.
In cyclonePORT Enterprise: the incoming sensor data is ingested and displayed as live readings on the station’s dashboard panel. Lightning monitoring notifications fire to authorized recipients per organization configuration. The PTZ camera stream is encoded and distributed through the cloud to authorized accounts simultaneously. The station marker on the radar map (in the paired RadarOmega view) updates with current location status in real time; opening the cyclonePort display surfaces the unit’s current sensor readings, alerts, and camera.
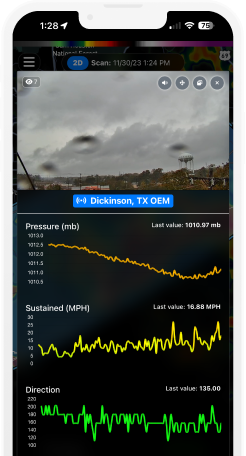
For the operator: opening the cyclonePort display shows the unit’s current sensor readings, trend sparklines for the past 20 minutes, active WBGT alerts (if configured), and the live camera stream. The radar map and NWS warnings are available alongside in RadarOmega. No separate login.
07 What ‘Live Weather Radar’ Actually Means vs. What You Need On-Site
People searching for ‘live weather radar’ are often looking for two different things: regional storm tracking (which NEXRAD radar does well) and real-time conditions at their specific location (which only an on-site weather station can provide). Understanding the distinction — and how cyclonePort plus RadarOmega provides both — clarifies why the integration between the two is the right answer to both searches.
Characteristic | NEXRAD Doppler Radar | cyclonePort On-Site Station |
|---|---|---|
What it covers | A region, typically 100–200 miles radius from the radar site | A single facility, campus, or location |
What it measures | Precipitation location and intensity, storm movement, Doppler wind velocity aloft, hail, tornado rotation | Surface temperature, humidity, heat index, wind speed and direction, pressure, rainfall, lightning proximity, WBGT |
Update rate | Every 2–10 minutes (varies by scan mode) | Every 5 seconds |
Can it drive heat safety protocols? | No — radar provides no temperature, humidity, or heat index data | Yes — heat index, WBGT, and all safety threshold calculations derive from on-site sensor readings |
Can it drive lightning safety protocols? | Partially — indicates storm presence, cannot provide precise strike distance at your location | Yes — on-site lightning detection provides real-time proximity data for custom range protocols |
Post-event documentation | Archived radar loop — cannot reconstruct surface conditions at a specific address | Full sensor log and camera archive provides site-specific, timestamped condition record for insurance and compliance |
Available in RadarOmega? | Yes — NEXRAD Doppler radar is available with RadarOmega | Yes — cyclonePort station data is accessible alongside the same radar map for cyclonePORT Enterprise customers |
The right answer to ‘live weather radar’ for most organizations is not one or the other — it is both, integrated. RadarOmega with cyclonePort integration provides the regional storm picture (radar) and the ground-truth local reality (on-site sensors + camera) in a single platform, with each layer complementing the other’s limitations.
08 Operational Applications — Who Uses Live Weather Monitoring Stations
Emergency Management Agencies
Emergency managers require real-time situational awareness across a jurisdiction — not a single airport reading, but a network of ground-truth observations that reveal where conditions are most severe, where cooling centers are most urgently needed, and what conditions are along evacuation routes. A network of cyclonePort stations across a county or municipality provides this spatial picture: temperature, heat index, and lightning proximity data updated every 5 seconds, with live camera feeds from key locations for visual confirmation.
The integration with NWS operational workflows is direct. cyclonePort station data and live video feeds — accessible to authorized partners — have been used by NWS forecast offices to supplement their observational network during severe weather events. Stanton County EMA noted explicitly that the station’s live video enhances NWS situational awareness for forecasting and warning decisions. This ground-truth capability closes the gap between model output and actual conditions at specific locations.
Schools, Athletic Programs, and Universities
Schools and universities manage the most complex heat and lightning safety challenge: large numbers of students outdoors across multiple activity sites, with strict regulatory compliance requirements and high liability exposure. A single cyclonePort station covers the entire campus from a single data stream — WBGT for heat safety, lightning proximity for storm protocols, wind chill for winter operations, and all condition logs for compliance documentation.
The live camera is particularly valuable for schools as a communication tool: when a coach or athletic director needs to make the call to suspend practice and convince parents and athletes that the call is justified, a live image of the approaching storm is more persuasive than any sensor reading. The camera makes the threat visible — and visible threats drive action.
Dawson County School System (Georgia) uses cyclonePort and cyclonePORT Enterprise for lightning detection and heat-risk decisions across the district — citing the ability to detect lightning, monitor heat risk, and make better safety decisions faster than ever as the core operational benefit.
Broadcast Meteorology and Media
Television meteorologists depend on two things for compelling, accurate severe weather coverage: the best radar data available, and visual ground-truth from the field. cyclonePort plus RadarOmega provides both. RadarOmega — already used by broadcast meteorologists for professional-grade NEXRAD data — pairs with cyclonePORT Enterprise where camera feeds and sensor data from deployed stations live for authorized partners.
For stations building a regional severe weather surveillance network, cyclonePort provides the infrastructure: multiple stations, each with sensor data and live video, accessible to designated broadcast partners.
Construction and Industrial Sites
Large construction projects — particularly those with tower cranes — have weather monitoring requirements mandated by OSHA. cyclonePort provides the on-site wind speed, wind direction, temperature, heat index, WBGT, and lightning detection data that compliance requires. The visual record from the camera adds value primarily as documentation and emergency communication: when a job-site supervisor needs to halt a lift and explain the call, the camera provides an image worth more than any wind reading. WBGT is the recommended metric for heat-stress decisions at the job site.
For OSHA heat compliance, the combination of real-time WBGT and heat index data, plus timestamped historical logs, provides the documented record that demonstrates worksite monitoring at the specific location where workers are exposed — not at a distant weather station that may not represent actual conditions.
Public Safety and Utility Operations
Utilities managing substations, transmission infrastructure, and pipeline networks need ambient temperature, wind, and lightning data at specific asset locations — not regional interpolations. cyclonePort stations at critical infrastructure sites provide the site-specific data that thermal loading calculations, de-icing decisions, and lightning protection system operation require.
For first responders and public safety agencies, live camera access through cyclonePORT Enterprise provides visual situational awareness at deployed station locations — valuable during disaster response when ground-level visual information from remote locations is difficult to obtain and when commanders need to show the situation to coordinate the response.
Ports, Harbors, and Marine Operations
Harbor pilots and port operations managers need precise, site-specific wind and visibility data before vessels approach a berth or navigate a channel — not regional marine forecasts that may not reflect conditions inside the harbor. A cyclonePort station on a dock or breakwater provides real-time wind speed and direction at the berth face, fog and visibility conditions via the live camera, and precipitation status for cargo handling decisions. For port terminals with cranes handling containers, wind speed and direction data at the dock is both an operational requirement and an OSHA compliance input.
Quantified Outcomes
Deploying live weather monitoring produces measurable operational improvements across sectors.
- School and athletics districts: Reduced lightning-related game delays through automated strike proximity alerts that give operations teams the lead time to make correct suspend/resume decisions — avoiding both unnecessary cancellations and unsafe delays in clearing the field.
- Shipping terminals and port operations: Saved crane-hours during squall conditions by allowing terminal managers to confidently continue operations when on-site wind data confirmed conditions remained within safe limits, even as regional forecasts suggested precautionary shutdowns.
- City emergency operations centers: Closed flood-prone roads faster during flash flood events by combining real-time station rainfall rate data with live camera confirmation of rising water at bridge points — reducing the lag between actual conditions and closure decisions.
09 Deployment, Installation & Network Management
Deployment
Deployment typically runs 2–4 weeks from contract execution to live data in the cyclonePORT Enterprise platform — covering site assessment, hardware configuration, shipping, physical installation, connectivity setup, platform onboarding, and staff training. cyclonePort offers self-installation with remote support for straightforward deployments, or full turnkey installation through certified partners for complex or multi-site projects. cyclonePort hardware is offered to enterprise clients at this time.
- Connectivity: Cellular (4G LTE) is the standard connectivity option, eliminating dependence on facility WiFi infrastructure and enabling deployment in any location with cellular coverage. WiFi and wired Ethernet connections are also supported for campus or fixed-facility deployments.
- Camera installation: PTZ cameras connect via WiFi or direct Ethernet, with plug-and-play setup. Static IP configuration is available for network-managed deployments.
- Platform onboarding: The station appears in cyclonePORT Enterprise immediately upon connection. Camera operator designations, lightning monitoring notification preferences, and dashboard configuration are set through the platform. No specialized technical staff required for ongoing operation.
Multi-Station Network Management
cyclonePORT Nexus — the organization-management layer of cyclonePORT Enterprise — gives a customer’s administrator centralized control over multiple stations across a campus, municipality, or operating region. The purpose of Nexus is to keep an organization’s policies in sync from one place: custom locations, weather alert notification preferences, lightning monitoring notifications, and camera operator designations are all configured at the org level. (Per-unit alert rules are not configured through Nexus; lightning monitoring notifications and camera operator designations are.)
- Multi-station map view: The cyclonePORT Enterprise dashboard surfaces all of an organization’s stations on the map, with all camera views visible simultaneously. Sensor data for an individual unit is displayed when that unit’s display is opened.
- Centralized organization policy: Configure shared preferences across all stations from a single Nexus interface — locations, lightning monitoring notification recipients, and camera operator assignments.
- User access tiers in Nexus: Nexus supports tiered users within an organization. The tier determines whether a user can manage organization policy and other users, not what cyclonePORT Enterprise data they can see.
- Historical data within the platform: Sensor logs and camera footage history are available to authorized users within cyclonePORT Enterprise. Sensor data export is not available at this time.
- Remote diagnostics and maintenance: Sensor health monitoring, firmware updates, and system diagnostics are managed remotely through the platform, reducing on-site maintenance requirements.
10 System Specifications
Parameter | Specification |
|---|---|
Temperature | ±0.2°C accuracy; –40°C to +60°C range; platinum RTD sensor; radiation-shielded housing |
Relative Humidity | ±2–3% RH accuracy; 0–100% RH range; capacitive sensing element |
Wind Speed | 0–75 m/s range; ±0.3 m/s accuracy (ultrasonic); sub-0.2-second response; ultrasonic preferred |
Wind Direction | 0–360°, no dead zone; ±2–3° accuracy; vector-averaged; true-north referenced |
Barometric Pressure | ±0.5 hPa accuracy; full-range absolute and sea-level equivalent output; 1 hPa resolution |
Rain Gauge | Tipping-bucket; 0.01 in (0.2 mm) resolution; rate and accumulation reporting |
Lightning Detection | Real-time proximity detection and distance reporting; configurable alert thresholds |
Heat Index | NWS Rothfusz formula with adjustments; computed in real time; NWS risk category display |
Wind Chill | NWS 2001 formula; computed when T ≤50°F and wind >3 mph; frostbite risk category display |
Sensor Update Rate | Every second; configurable averaging intervals (1, 2, 5, 10, 60 minutes) |
PTZ Camera | HD resolution; full pan-tilt-zoom; WiFi or Ethernet; static IP capable; multiple cameras per station |
Camera Streaming | Live stream accessible in RadarOmega (mobile and desktop); publicly viewable at cycloneport.com network dashboard |
Connectivity | Cellular (4G LTE), WiFi, or Ethernet; HTTPS encrypted transmission |
Platform | RadarOmega — iOS, Android, Windows, Mac, Linux; web browser access |
Remote Management | Full remote toolkit for diagnostics, configuration, firmware updates, and camera PTZ control |
Data Export | CSV and JSON with timestamps; REST API available; SCADA integration supported |
Alert Delivery | SMS, email, push notification; configurable per threshold and per recipient |
Environmental Rating | IP65+ station housing; operating temperature –40°C to +60°C |
Station Lifespan | 10+ years with standard maintenance |
Specifications may vary by configuration and model. Contact cyclonePort for current engineering documentation and deployment options.
Deploy Live Weather Monitoring at Your Facility cyclonePort weather surveillance stations are available for single-site and multi-site network deployments. Contact our team to configure sensor suite, camera setup, connectivity, and alert thresholds for your specific application. Deployment timelines measured in weeks, not months. info@cycloneport.com · 844-737-9328 · cycloneport.com/contact |
11 Frequently Asked Questions
What is a live weather monitoring station?
A live weather monitoring station is a permanent system of calibrated sensors deployed at a specific facility that continuously measures atmospheric conditions — like temperature, humidity, wind speed and direction, barometric pressure, rainfall, and lightning — and transmits that data in real time to a cloud platform accessible from any device. Unlike a weather app that interpolates data from a distant airport, a live monitoring station measures conditions at your exact location and updates every 5 seconds. cyclonePort additionally integrates a side-mounted PTZ live-streaming HD camera with the sensor data, providing visual confirmation and emergency-communication value alongside the instrument readings — accessible through the cyclonePORT Enterprise platform.
What weather equipment is used in a professional weather monitoring station?
A professional weather monitoring station typically includes: a temperature and humidity sensor (inside a radiation shield), an anemometer for wind speed, a wind vane or ultrasonic wind sensor for wind direction, a barometric pressure sensor, a tipping-bucket rain gauge, and a lightning detection module. Professional stations compute derived metrics from these sensors in real time — heat index, wind chill, dew point, and WBGT. cyclonePort adds an HD PTZ camera for live streaming and operates through the cyclonePORT Enterprise platform; NEXRAD Doppler radar is available with RadarOmega. Each component is IP-rated for continuous outdoor deployment.
What is the difference between live weather radar and a weather monitoring station?
Live weather radar (Doppler/NEXRAD) shows precipitation location and intensity, storm movement, and velocity across a wide region — typically a 100–200 mile radius. It cannot measure surface temperature, humidity, heat index, surface wind speed, or lightning proximity at your specific location. A weather monitoring station measures all of these surface parameters at your exact facility, updated every 5 seconds. The two are complementary: radar tells you what is approaching from miles away; the on-site station tells you what the conditions are right now at your location. cyclonePort customers get both — cyclonePORT Enterprise for sensor and camera data, RadarOmega for radar and NWS warnings.
Can I see live weather camera footage from a cyclonePort station?
Yes — for authorized accounts. Every cyclonePort station includes an HD, side-mounted PTZ camera that live-streams to the cyclonePORT Enterprise platform. Camera access is granted to cyclonePort hardware owners and the individual users they designate within their organization; control is per-account, not per-device. Authorized users can view the live camera feed alongside sensor data from any iOS, Android, Windows, Mac, or Linux device. Public RadarOmega users do not control cyclonePort cameras.
Why is on-site weather monitoring better than a weather app?
Weather apps interpolate data from NWS observation stations — typically at airports — that may be miles away from your facility. They report conditions for a general area, not your specific location. Surface cover differences (asphalt vs. grass), urban heat island effects, local topography, and proximity to water bodies can all produce temperature and humidity conditions at your facility that differ meaningfully from the nearest official station. This difference can mean the gap between Caution and Danger on the NWS heat index scale, or the difference between a safe and unsafe wind chill for outdoor workers. On-site monitoring eliminates the geographic gap by measuring conditions exactly where your people are. WBGT is recommended as the gold-standard metric for heat-stress decisions.
How does cyclonePort integrate with RadarOmega?
cyclonePORT Enterprise is the platform hardware customers use to manage their cyclonePort stations, and is built by the team behind RadarOmega — the professional weather radar app used by 261,000+ subscribers. cyclonePORT Enterprise is powered by RadarOmega data. Customers run their day-to-day operations in cyclonePORT Enterprise (their stations, sensors, cameras, alerts) while using RadarOmega for the wide-area radar and NWS warning context. The two platforms are designed to work together.
What alerts does a cyclonePort weather monitoring station send?
cyclonePort’s notification model is focused on lightning monitoring for cyclonePORT Enterprise users. Lightning monitoring notifications are configurable per organization and incorporate strikes detected by the cyclonePort network. WBGT thresholds can be set against custom organizational policy, with notification capability for WBGT thresholds in development. General sensor-threshold notifications (e.g., heat index, wind speed) are not currently sent as push or SMS alerts — those values are monitored directly in the cyclonePORT Enterprise display. Email alerts are not part of the notification model.
What sectors and organizations use cyclonePort weather monitoring stations?
cyclonePort stations are deployed across emergency management agencies (county and municipal), K–12 school districts, university athletic programs, broadcast television meteorology departments, construction and industrial sites, utility companies, public safety agencies, and private facilities including stadiums and sports complexes. The combination of professional-grade sensor accuracy, side-mounted PTZ live streaming, and a paired RadarOmega + cyclonePORT Enterprise workflow serves any enterprise organization where accurate, real-time, site-specific weather data and visual situational awareness are operationally critical.
Related Instruments & Guides
A cyclonePort weather surveillance station integrates multiple instruments into a single platform. Explore individual instrument pages for technical depth on each component:
↗ Temperature Sensor & Heat Index — Dry bulb temperature, heat index calculation, and NWS danger thresholds [link]
↗ WBGT Monitor & Heat Stress Sensor — The gold-standard heat stress metric for athletics and outdoor workers [link]
↗ Lightning Detection System — Strike proximity alerting, 30/30 rule protocols, and integration with RadarOmega [link]
↗ Wind Meter & Anemometer — Wind speed and gust measurement for storm approach and operational safety [link]
↗ Wind Vane & Wind Direction Sensor — Continuous 0–360° directional monitoring and wind shift alerting [link]
↗ Barometric Pressure Sensor — Pressure trend analysis as the earliest automated storm approach signal [link]
↗ Rain Gauge — Precipitation measurement for storm documentation and compliance records [link]
↗ Humidity Sensor & Hygrometer — Relative humidity, dew point, and heat index calculation [link]






Built for Severe Weather
Remote system management from anywhere
Deploy high-quality PTZ (Pan-Tilt-Zoom) IP cameras designed for effortless setup and immediate operation through plug-and-play simplicity. This advanced design significantly reduces installation time and complexity, making sophisticated surveillance accessible for businesses of all sizes. Multiple cameras connect seamlessly to the network.
Remote system management from anywhere
Deploy high-quality PTZ (Pan-Tilt-Zoom) IP cameras designed for effortless setup and immediate operation through plug-and-play simplicity. This advanced design significantly reduces installation time and complexity, making sophisticated surveillance accessible for businesses of all sizes. Multiple cameras connect seamlessly to the network.
Remote system management from anywhere
Deploy high-quality PTZ (Pan-Tilt-Zoom) IP cameras designed for effortless setup and immediate operation through plug-and-play simplicity. This advanced design significantly reduces installation time and complexity, making sophisticated surveillance accessible for businesses of all sizes. Multiple cameras connect seamlessly to the network.
Remote system management from anywhere
Deploy high-quality PTZ (Pan-Tilt-Zoom) IP cameras designed for effortless setup and immediate operation through plug-and-play simplicity. This advanced design significantly reduces installation time and complexity, making sophisticated surveillance accessible for businesses of all sizes. Multiple cameras connect seamlessly to the network.