Barometric Pressure Sensor
Professional barometric pressure sensor for weather surveillance networks — delivering continuous atmospheric pressure measurements, sea-level-adjusted pressure reporting when elevation correction is applied, pressure-trend insight for changing weather conditions, and high-quality data for emergency management, outdoor operations, industrial safety, and scientific applications.
Contents
01 The Instrument — What a Barometric Pressure Sensor Measures
02 Types of Barometers — From Mercury to MEMS
03 How Barometric Pressure Sensors Work — Sensor Technology
04 Pressure Units — hPa, inHg, and mb Explained
05 What Is High, Low, and Normal Barometric Pressure?
06 What Factors Affect Barometric Pressure?
07 Pressure Trend vs. Absolute Pressure — Why Rate of Change Matters More
08 Operational Applications
09 Instrument Selection Guide
10 Installation & Maintenance
11 cyclonePort Barometric Pressure Sensor — Platform, Integration & Deployment
12 Frequently Asked Questions

- 0.03–0.5 hPa
- 300–1100 hPa
- 0.01 hPa
- RadarOmega
01 The Instrument — What a Barometric Pressure Sensor Measures
A barometric pressure sensor — also called a barometer or atmospheric pressure sensor — measures atmospheric pressure at the sensor location, which reflects the weight of the air column above it. Pressure is typically expressed in hectopascals (hPa), millibars (mb), or inches of mercury (inHg), and it is one of the most important variables in meteorology because pressure level and pressure trend provide valuable insight into changing weather conditions and the approach of weather systems.
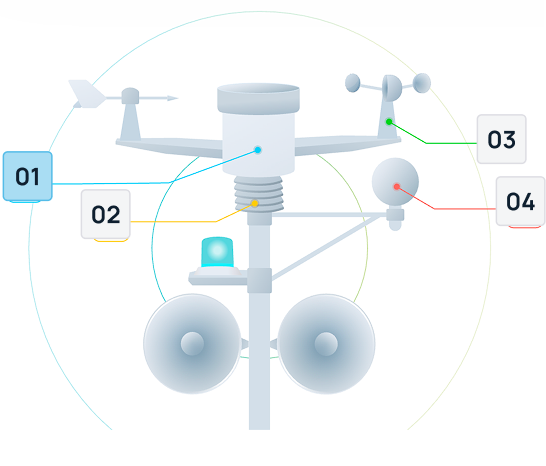
In a cyclonePort weather monitoring system, the barometric pressure sensor operates continuously alongside wind, temperature, humidity, rain gauge, and lightning detection. The pressure reading is logged in real time, sea-level-referenced for comparability across elevations, and delivered through RadarOmega.
Why pressure is the foundational weather variable Barometric pressure is a foundational weather variable because changing pressure patterns often provide some of the earliest local signals of approaching weather changes. By tracking pressure continuously, weather surveillance systems can detect trends associated with frontal passages, storm-system approach, and shifting large-scale weather patterns — insight that becomes even more powerful when combined with radar, wind, temperature, and humidity data. |
The barometric pressure sensor in a cyclonePort station uses a MEMS (microelectromechanical systems) capacitive sensing element — the industry standard for professional weather instrumentation. The sensor provides ±0.03 to ±0.5 hPa accuracy depending on model, with 0.01 hPa resolution and continuous logging at configurable intervals from 1 second to 1 hour. All readings are automatically referenced to sea level so that pressure data from stations at different elevations can be directly compared.
02 Types of Barometers — From Mercury to MEMS
The barometer has evolved over nearly four centuries — from a glass tube of mercury to a silicon chip smaller than a fingernail. Understanding the three main barometer types provides useful context for why digital MEMS sensors are the standard for professional weather surveillance deployments.
Mercury Barometers — The Original Standard
The mercury barometer was invented by Evangelista Torricelli in 1643. A sealed glass tube filled with mercury is inverted into an open mercury reservoir; atmospheric pressure pushes down on the reservoir surface, supporting a column of mercury in the tube whose height is proportional to the current atmospheric pressure. At standard sea-level pressure, this column stands at approximately 760 mm (29.92 inches) of mercury — which is why inHg remains a standard pressure unit to this day.
Mercury barometers were the reference standard for meteorology and aviation for over 300 years. They are exceptionally accurate when properly calibrated, and the primary global reference network used mercury instruments well into the 20th century. However, mercury toxicity — vapor inhalation risk during handling, and environmental contamination from spills — led to significant regulatory restrictions. The European Union banned new mercury barometers in 2007. Modern professional meteorology has fully transitioned to electronic sensors that equal or exceed mercury accuracy without the hazards.
Aneroid Barometers — Mechanical Sensing
Lucien Vidi patented the aneroid barometer in 1844 — aneroid meaning ‘without liquid.’ An evacuated, flexible metal capsule called an aneroid cell expands and contracts as atmospheric pressure changes around it. Mechanical linkages amplify this tiny movement and transfer it to a needle on a dial, often marked with qualitative weather condition labels such as ‘Stormy,’ ‘Change,’ and ‘Fair.’
Aneroid mechanisms were a major advance: portable, robust, with no liquid hazards. They became standard on ships, aircraft, and in field instruments. The aneroid principle evolved directly into the pressure altimeter used in aviation and mountaineering — still in use today. The limitation is mechanical drift over time and the need for periodic manual recalibration against a reference. For networked weather surveillance requiring continuous digital data, aneroid mechanisms have been replaced by electronic sensors.
Digital MEMS Barometers — The Professional Standard
Modern professional barometers use MEMS (microelectromechanical systems) technology — the same semiconductor fabrication processes used to manufacture computer chips applied to create microscopic mechanical sensing structures. A MEMS pressure sensor achieves what mercury barometers required a meter-tall glass tube to accomplish: it fits on a silicon chip a few millimeters across, consumes milliwatts of power, produces a calibrated digital output, and achieves accuracy comparable to or better than its historical predecessors.
cyclonePort weather stations use industrial-grade capacitive MEMS barometric pressure sensors — not the consumer-grade variants found in smartphones, but hardened versions designed for continuous outdoor deployment, wide temperature range operation, and long-term calibration stability.
03 How Barometric Pressure Sensors Work — Sensor Technology
Modern barometric pressure sensors are MEMS devices — microelectromechanical systems fabricated on silicon chips using semiconductor manufacturing processes. Despite their millimeter-scale dimensions, professional-grade MEMS pressure sensors achieve the accuracy and stability required for meteorological and industrial applications.
Capacitive MEMS Sensing — The Professional Standard
In a capacitive MEMS barometric pressure sensor, a microscopic silicon diaphragm is suspended above a sealed reference cavity. Atmospheric pressure acts on one face of the diaphragm; the sealed reference pressure acts on the other. Changes in atmospheric pressure deflect the diaphragm toward or away from a fixed electrode below it, changing the electrical capacitance between the two surfaces. An onboard ASIC (application-specific integrated circuit) measures this capacitance change and converts it to a calibrated pressure value.
Capacitive sensing offers key advantages for professional weather applications: superior temperature stability (capacitance-based measurement is inherently less sensitive to temperature variation than resistance-based alternatives), lower power consumption, higher resolution at low pressure differentials, and better long-term stability with less drift.
Piezoresistive Sensing — The Alternative
Piezoresistive barometric pressure sensors use a silicon diaphragm with diffused strain gauges on its surface. Pressure deflection of the diaphragm changes the electrical resistance of the strain gauges in proportion to the applied pressure. Piezoresistive sensors offer excellent linearity and are straightforward to manufacture, but require more complex temperature compensation circuitry because the piezoresistive effect is temperature-sensitive.
Calibration and Sea-Level Correction
Every professional barometric pressure sensor ships with factory calibration coefficients stored in onboard memory. These coefficients correct for manufacturing variations in the diaphragm geometry and electronics, producing a calibrated absolute pressure reading in hPa.
Because atmospheric pressure decreases predictably with elevation, a sensor at any elevation above sea level will always read lower than a sensor at sea level, even in identical weather conditions. For the pressure reading to be meteorologically meaningful and comparable to readings from other stations and NOAA weather data, the raw station pressure must be corrected to its sea-level equivalent. cyclonePort weather stations perform this correction automatically using the site’s GPS-determined elevation, reporting sea-level pressure in RadarOmega alongside the raw station pressure for reference.
04 Pressure Units — hPa, inHg, and mb Explained
Barometric pressure is expressed in several units depending on the application context. All are equivalent measurements of the same physical quantity — the weight of the air column — expressed in different unit systems.
| Unit | Description & Context |
|---|---|
| hPa (hectopascals) | The international scientific and meteorological standard. 1 hPa = 100 pascals. Standard sea-level pressure: 1013.25 hPa. Used by international weather services, aviation (outside the U.S.), and scientific instrumentation. |
| mb (millibars) | Numerically identical to hPa (1 mb = 1 hPa = 100 Pa). The legacy unit used by U.S. meteorology. Still widely used on U.S. weather maps and NWS products. Standard sea-level pressure: 1013.25 mb. |
| inHg (inches of mercury) | The traditional U.S. unit, referencing the height of a mercury column in a classic mercury barometer. Standard sea-level pressure: 29.92 inHg. Used by NOAA radio weather broadcasts, aviation (U.S. altimeter settings), and consumer weather products in the United States. |
| mmHg (millimeters of mercury) | Rarely used in modern meteorology but still encountered in some medical and laboratory contexts. Standard sea-level pressure: 760 mmHg. Often treated as equivalent to the Torr unit. |
| atm (atmospheres) | Defined as exactly 101,325 Pa = 1013.25 hPa. Used in scientific and engineering contexts, not in operational meteorology. |
Conversion reference 1 hPa = 1 mb = 0.02953 inHg | 1 inHg = 33.864 hPa | Standard sea-level pressure: 1013.25 hPa = 1013.25 mb = 29.92 inHg = 760 mmHg. cyclonePort RadarOmega displays pressure in both hPa and inHg. |
05 What Is High, Low, and Normal Barometric Pressure?
The terms ‘high pressure,’ ‘low pressure,’ and ‘normal pressure’ refer to sea-level-referenced barometric pressure values relative to standard thresholds established by meteorological convention. These thresholds are guidelines, not hard physical boundaries — weather behavior depends heavily on pressure trend (whether pressure is rising or falling) and on regional climate norms.
What Is Normal Barometric Pressure?
At sea level, barometric pressure near about 29.80 to 30.20 inHg (1009 to 1023 hPa) is often considered a typical day-to-day range, though there is no single universal “normal” value in real-world weather. The standard reference sea-level pressure used in meteorology is 1013.25 hPa (29.92 inHg), but this is a defined standard-atmosphere value rather than a true average for all locations and seasons. Pressure within a typical range can still vary from day to day due to atmospheric tides, seasonal patterns, latitude, and passing weather systems.
Normal pressure does not mean unchanging pressure. What ‘normal’ indicates is the absence of a strongly dominant weather system driving pressure significantly above or below baseline.
What Is High Barometric Pressure?
At sea level, readings above about 30.20 inHg (1023 hPa) are commonly described as high pressure. High-pressure systems are often associated with sinking air, atmospheric stability, lighter winds, and fewer clouds, which is why they are commonly linked to fair weather. However, strong persistent highs can also produce heat waves, stagnant air, or intense winter cold depending on season and location. Rising pressure often indicates improving or more stable weather, while pressure that slowly falls from a high may suggest a gradual change toward less stable conditions.
What Is Low Barometric Pressure?
At sea level, readings below about 29.80 inHg (1009 hPa) are commonly described as low pressure. Low-pressure systems are often associated with rising air, cloud development, precipitation, and more unsettled weather. In general, deeper lows and faster pressure falls can indicate a stronger weather system, but the specific impacts depend on the type of system and local conditions. Falling pressure often suggests worsening weather, and rapid pressure drops can be an important warning sign of an approaching strong storm.
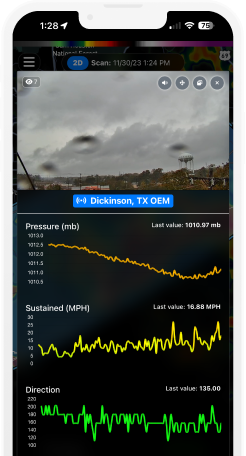
Pressure trend tells more than absolute value A reading of 29.85 inHg that has fallen from 30.10 inHg over the past 3 hours is far more significant — and dangerous — than a reading of 29.80 inHg that has been stable for 24 hours. Meteorologists weigh pressure tendency (rate and direction of change) as a primary forecast signal. Through RadarOmega, cyclonePort plots continuous pressure trend charts alongside the current value, giving operators the full picture: not just where pressure stands but where it is going and how fast. |
06 What Factors Affect Barometric Pressure?
Barometric pressure at any location is the product of multiple overlapping influences operating at different spatial and temporal scales. Understanding these factors is essential for correctly siting a barometric pressure sensor, interpreting its readings, and avoiding common errors in pressure-based weather forecasting.
Elevation and Altitude
Elevation is the largest and most predictable factor affecting absolute barometric pressure. As elevation increases, the column of air above the measurement point decreases, reducing the weight pressing down on the sensor. Near sea level, pressure decreases by approximately 1 hPa for every 8 meters of elevation gain (roughly 1 inHg per 1,000 feet). This relationship is not linear — the rate of pressure decrease slows at higher altitudes as the atmosphere becomes less dense. At 5,500 meters (18,000 feet), pressure is approximately half of sea-level pressure.
This is why all operational meteorology references pressure to a common sea-level datum. A barometric pressure sensor installed at a facility 500 feet above sea level will consistently read approximately 15 hPa (0.5 inHg) lower than the sea-level standard — not because the weather is different, but because there is simply less air above it. cyclonePort automatically applies the elevation correction, reporting sea-level equivalent pressure for meteorological comparability.
Temperature
Temperature affects pressure indirectly through its influence on air density, atmospheric thickness, and the development of pressure gradients between regions. Warm air is less dense than cold air, but the relationship between local temperature and local surface pressure is not always direct. For example, pressure may rise as temperature falls during the arrival of a cold high-pressure system, because both changes are caused by the same broader weather pattern. In practice, temperature and pressure should be interpreted together as part of the larger synoptic environment rather than as a simple one-to-one cause-and-effect pair.
Indoor vs. Outdoor Pressure
Barometric pressure sensors installed indoors or in enclosed structures will typically read differently from sensors installed in the open air, for reasons that matter significantly to sensor placement decisions.
- HVAC systems: Forced-air heating and cooling systems pressurize or depressurize building interiors relative to outside. A building running positive-pressure ventilation may be 1–5 hPa above outdoor ambient. Negative-pressure exhaust ventilation produces the opposite effect.
- Building infiltration: In windy conditions, the windward side of a building experiences higher pressure than the leeward side. Sensors near doors, windows, or air intakes on the windward face may read falsely elevated pressure.
- Sealed environments: Tightly sealed industrial enclosures, cold storage facilities, and pressurized spaces maintain internal pressures that differ substantially from ambient atmospheric pressure.
- Temperature differential: Even without active HVAC, a warm interior vs. cold exterior creates a small pressure differential through thermal buoyancy effects.
For meteorological accuracy, cyclonePort barometric pressure sensors are always installed in the station’s external sensor housing with proper radiation shielding and passive ventilation — never in building interiors.
Topography and Local Geography
Topography and local geography can modify pressure patterns on mesoscale and local scales, especially in mountainous, coastal, and urban environments. Terrain can channel airflow, strengthen or weaken local pressure gradients, and superimpose local effects on broader regional weather patterns. Coastal land-water contrasts drive sea-breeze and land-breeze cycles that can produce daily pressure variations, and urban heat-island effects can contribute to weak local circulations relative to surrounding rural areas. These effects are usually smaller than the influence of large-scale weather systems, but they can matter operationally in complex terrain.
Humidity
Humidity affects air density because water vapor is lighter than the nitrogen and oxygen it partially displaces. As a result, moist air is less dense than dry air at the same temperature and pressure. In most routine weather situations, the direct effect of humidity on measured barometric pressure is small compared with the effects of elevation and large-scale weather systems, but humidity still influences the buoyancy and structure of air masses and therefore contributes indirectly to pressure patterns.
Diurnal (Daily) Pressure Cycles
The atmosphere experiences regular daily pressure oscillations known as atmospheric tides, driven primarily by solar heating of the atmosphere. These cycles typically produce two pressure maxima and two minima per day, with amplitudes often around 1–2 hPa in mid-latitudes and somewhat larger values in the tropics. Because these variations can be similar in magnitude to weak weather-driven changes, high-resolution pressure analysis should distinguish normal diurnal cycles from true storm-related pressure trends.
07 Pressure Trend vs. Absolute Pressure — Why Rate of Change Matters More
The most operationally important information from a barometric pressure sensor is not the current reading — it is the trend. How fast is pressure changing? In which direction? How does the current rate of change compare to the past hour, the past three hours, the past 24 hours?
| Pressure Tendency | Weather Implication & Operational Action |
|---|---|
| Rapid fall (>2–3 hPa/hr) | Strong signal of rapidly changing weather, often associated with an approaching front, deepening low, or nearby convective disturbance. |
| 3–6 hPa drop in 3 hours | Meaningful short-term pressure fall that may indicate an approaching mesoscale disturbance, convective system, or boundary passage. |
| Steady fall (1–2 hPa/hr) | Often indicates worsening weather potential or the approach of a lower-pressure system. |
| Slow fall (<1 hPa/hr) | Weak signal of gradual weather change; most useful in combination with other indicators. |
| Steady (no significant change) | Suggests a relatively stable pattern in the short term. |
| Slow rise (2–5 hPa/12hr) | Often associated with improving weather or a building high-pressure system. |
| Rapid rise | Often follows frontal passage or the exit of a storm system; improving weather may be accompanied by gusty winds. |
cyclonePort displays continuous pressure trend charts alongside the current reading.
08 Operational Applications
Weather Forecasting and Storm Approach Detection
The primary operational role of the barometric pressure sensor in a cyclonePort station is storm approach detection — using continuous pressure trend data to decipher early signals of deteriorating weather conditions, independent of visual observation or radar availability.
A professional on-site barometric pressure sensor gives operations teams something no regional weather forecast can: the actual current pressure at their specific location, updated continuously in real time. Regional weather apps and forecasts report pressure from the nearest observation station, which may be miles away and at a different elevation.
- Emergency management and public safety: Continuously monitored pressure data helps decision-makers understand changing weather and enable earlier activation of shelters, evacuation protocols, and public notification systems.
- Outdoor event operations: Pressure trend data helps provide advance warning of deteriorating conditions, giving event operators time to modify schedules, prepare shelter logistics, and make go/no-go decisions proactively.
- Aviation ground support: At private airfields and aviation support facilities, barometric pressure data is important for local altimeter setting awareness and for monitoring changing weather conditions during frontal passages and other operationally significant events. Pressure data should be used in accordance with applicable aviation standards and official weather sources.
- Industrial outdoor operations: Construction, energy, agriculture, and mining operations use pressure trend data to plan around weather windows and activate safety protocols in advance of approaching severe weather.
Fishing Barometer — How Anglers Use Barometric Pressure
Barometric pressure is one of the most widely tracked variables among serious anglers — both freshwater and saltwater — because research and long experience suggest it influences fish behavior through its effect on the swim bladder, an internal gas-filled organ that fish use to maintain buoyancy.
A cyclonePort weather station near a fishing facility, marina, or recreational water body provides continuous, real-time barometric pressure with trend visualization. Anglers can check the RadarOmega dashboard to see whether pressure is rising, falling, or stable — and at what rate.
Utilities and Industrial Monitoring
Barometric pressure data is operationally relevant for utilities, industrial facilities, and infrastructure operators across several dimensions. Rapidly falling pressure is often the earliest indicator of approaching severe weather that threatens power infrastructure, outdoor workers, and operational continuity. cyclonePort stations along transmission corridors, substations, and industrial facilities provide the advance pressure trend data that enables coordinated storm preparation — moving crews to safety, securing equipment, and pre-positioning repair resources — hours before impactful weather arrives.
Industrial processes that are sensitive to ambient pressure — combustion efficiency, boiler operations, HVAC system balance, and certain chemical processes — benefit from continuous on-site atmospheric pressure monitoring that provides real conditions rather than forecast values from distant observation stations.
Emergency Management
For emergency management, pressure trends are a valuable supporting signal of changing weather across a monitored region. cyclonePort networks provide real-time, site-specific pressure measurements and trend visualization that add local confirmation to forecast and radar workflows, helping decision-makers see where weather conditions are evolving and where closer attention is needed.
09 Instrument Selection Guide
Barometric pressure sensors for weather surveillance vary widely in accuracy, temperature stability, and operational suitability. These are the criteria that determine whether a sensor provides meteorologically reliable data or an unreliable approximation.
| Specification | What to Require |
|---|---|
| Sensing Technology | Both capacitive and piezoresistive MEMS sensors can be used in weather instruments, but high-quality capacitive MEMS designs are often preferred for low power consumption, strong long-term stability, and excellent continuous-monitoring performance. |
| Accuracy | For professional weather monitoring, absolute accuracy on the order of ±0.1 to ±0.5 hPa is generally desirable. Higher-end scientific applications may seek tighter specifications, while consumer-grade devices may allow substantially larger error. |
| Resolution | Fine resolution — ideally around 0.01 hPa — is useful for trend analysis, but it should be evaluated together with noise, repeatability, and actual calibrated accuracy. |
| Temperature Compensation | Verify that the pressure sensor and its electronics are compensated across the stated operating range and that temperature-related error is clearly specified. |
| Sea-Level Correction | For meteorological comparison across sites, the system should support automatic sea-level reduction using accurate elevation data, while still preserving measured station pressure. |
| Update Rate | Frequent updates, typically on the order of 1 minute or faster, improve local trend monitoring. Faster rates may be useful in industrial or research applications. |
| Logging and Trend Display | Historical logging and trend charts are essential because pressure tendency is often more useful than a single current reading. |
| Integration | Barometric pressure data is most valuable when displayed alongside wind speed, temperature, humidity, rain gauge, and lightning detection from the same station — providing the complete meteorological context for each pressure reading. |
10 Installation & Maintenance
Siting Requirements
- Outdoor installation required: The sensor must be exposed to ambient outdoor atmospheric pressure. Indoor installation — even in a vented enclosure inside a building — introduces HVAC pressure effects and temperature artifacts that degrade accuracy. cyclonePort pressure sensors are integrated into the station’s external sensor housing.
- Away from building pressurization effects: Mount the station away from HVAC intakes, exhausts, loading dock doors, and building facades that experience wind-driven pressurization. A minimum of 5–10 meters of clearance from large structures is recommended for unobstructed ambient pressure exposure.
- Elevation documentation: The station setup must include accurate GPS elevation data for the installation site. An elevation error of 10 meters introduces approximately 1.2 hPa error in the sea-level correction — significant for professional applications.
- Away from local heat sources: Generators, HVAC compressors, and other heat-generating equipment can create local thermal pressure effects. Mount the station in a location representative of ambient conditions.
Maintenance
MEMS barometric pressure sensors require minimal field maintenance. Their sealed silicon construction provides long-term stability without moving parts or consumable elements. Maintenance protocols for the barometric pressure sensor within a cyclonePort station include:
- Annual accuracy verification: Compare the station’s sea-level-corrected pressure reading against a reference source — the nearest NWS ASOS station, NOAA Weather Radio, or a calibrated reference sensor — during stable weather (steady pressure for 2+ hours). A discrepancy of more than ±2 hPa warrants sensor inspection or recalibration.
- Sensor port inspection: Verify the pressure equalization port on the sensor housing is not blocked by insect nests, debris, or moisture. A blocked port will prevent the sensor from responding to ambient pressure changes.
- Housing integrity: Inspect the sensor housing for cracks, moisture intrusion, or physical damage that could affect sensor performance.
- Elevation correction review: If the station is relocated, the elevation input for sea-level correction must be updated to reflect the new installation altitude.
11 cyclonePort Barometric Pressure Sensor — Platform, Integration & Deployment
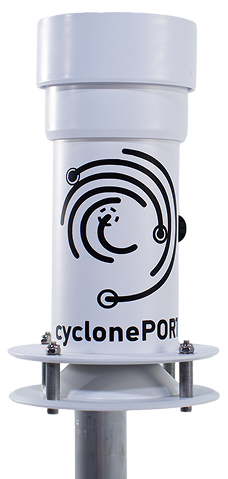
cyclonePort weather surveillance stations include a capacitive MEMS barometric pressure sensor as a core instrument in every standard configuration, delivering continuous sea-level-referenced pressure data through the RadarOmega platform alongside all other station sensor streams.
Technical Specifications
| Parameter | Specification |
|---|---|
| Sensor Technology | Capacitive MEMS barometric pressure sensor |
| Measurement Range | 300–1100 hPa (covers sea level to above 30,000 ft elevation) |
| Absolute Accuracy | ±0.03–0.5 hPa depending on model; factory-calibrated |
| Resolution | 0.01 hPa (1 Pa) |
| Temperature Compensation | Onboard ASIC provides continuous temperature correction; typical coefficient ±0.5 Pa/°C or better |
| Pressure Output | Station pressure (raw) and sea-level equivalent pressure (automatically corrected for elevation) |
| Pressure Units | hPa and inHg displayed simultaneously; mb notation equivalent to hPa |
| Update Rate | Configurable: 1-second to 60-minute intervals; continuous logging |
| Trend Reporting | 3-hour, 12-hour, and 24-hour pressure trend charts in RadarOmega; pressure tendency indicator (rising/steady/falling) |
| Alerts | Configurable thresholds for absolute pressure (low pressure approach) and pressure fall rate (storm approach velocity) |
| Operating Temperature | –40°C to +60°C; MEMS element thermally compensated across full range |
| Environmental Rating | IP65+; integrated into cyclonePort station sealed housing |
| Connectivity | Cellular, Wi-Fi, or Ethernet; |
| Data Access | Web portal, mobile app, REST API via RadarOmega |
| Data Export | CSV and JSON with timestamps; |
| Sea-Level Correction | Automatic; based on GPS-determined site elevation entered during station setup |
| Station Lifespan | 10+ years with standard maintenance |
Specifications may vary by model. Contact cyclonePort for current engineering documentation.
What the System Delivers
- Continuous real-time barometric pressure — both station pressure and sea-level-corrected pressure, updated at configurable intervals
- Pressure trend visualization — 3-hour, 12-hour, and 24-hour charts showing where pressure is and where it is heading
- Historical pressure archive — pressure history accessible for trend analysis and post-event review
- Multi-station pressure network — view real-time pressure readings from all stations in RadarOmega to track storm movement and front passage
- Full weather picture — pressure alongside wind, temperature, humidity, rain gauge, WBGT, lightning, and camera from the same station
- Remote access — all data accessible from any device via RadarOmega
Who Deploys cyclonePort Barometric Pressure Monitoring
| Sector | What cyclonePort Enables |
|---|---|
| Emergency Management | Real-time pressure trend data and multi-station pressure maps with data to decipher front passage timing and system intensity across monitored regions. |
| Outdoor Athletic Programs | Pressure trend monitoring as part of complete weather surveillance — identifying rapidly deteriorating conditions before impactful weather arrives. Combined with WBGT for heat monitoring and lightning detection for complete athletic safety platform. |
| Utilities & Infrastructure | Storm approach signals for crew planning and pre-positioning. Post-event pressure history for correlating damage patterns with storm intensity. Pressure monitoring at remote substations and transmission infrastructure. |
| Industrial & Construction | Pressure-based situational awareness for high-risk outdoor operations. |
| Marinas, Fishing, & Waterfront | Fishing barometer data for angler guidance and marina operations planning. |
| Research & Scientific | High-resolution continuous pressure logging for atmospheric research, microclimate studies, and long-term climate monitoring. |
Deploy Barometric Pressure Monitoring at Your Facility yclonePort barometric pressure sensors are available as part of complete weather surveillance stations. Contact our team to configure the right solution — sensor specifications and sea-level correction setup. info@cycloneport.com · 844-737-9328 · cycloneport.com/contact |
12 Frequently Asked Questions
What is a barometric pressure sensor and what does it measure?
A barometric pressure sensor measures atmospheric pressure at the sensor location — the force per unit area exerted by the weight of the air column above it. Pressure level and pressure trend are important indicators of changing weather conditions.
What is normal barometric pressure?
At sea level, about 29.80 to 30.20 inHg (1009 to 1023 hPa) is often treated as a typical range. The standard reference sea-level pressure is 1013.25 hPa (29.92 inHg), but that is a defined standard atmosphere value rather than a true global average.
What is considered high barometric pressure?
At sea level, readings above about 30.20 inHg (1023 hPa) are commonly considered high pressure and are often associated with stable weather, fewer clouds, and lighter winds.
What is considered low barometric pressure?
At sea level, readings below about 29.80 inHg (1009 hPa) are commonly considered low pressure and are often associated with unsettled weather, cloud development, and precipitation.
What is the best barometric pressure for fishing?
Many anglers focus more on pressure trend than on a single absolute number. Stable pressure and falling pressure ahead of fronts are both commonly watched, but local conditions and species behavior matter greatly.
How does elevation affect barometric pressure readings?
Pressure decreases with elevation because there is less air above the sensor. For meteorological comparison, station pressure is often reduced to sea-level pressure using the site elevation.
Why does the pressure trend matter more than the current reading?
Pressure trend shows how the atmosphere is changing over time and is often more useful for short-term operational awareness than a single current reading.
Related Instruments & Guides
Wind direction is one component of the complete cyclonePort weather station. Explore related instrument pages:
↗ Wind Meter & Anemometer — Wind speed, gust measurement, and Beaufort/Saffir-Simpson context
↗ Barometric Pressure Sensor — Pressure trend analysis for front detection alongside directional wind data
↗ Lightning Detection System — Lightning detection integrated with wind direction for complete storm awareness
↗ WBGT Monitor & Heat Stress Sensor — Heat stress monitoring with wind direction context for heat index and comfort
↗ Temperature Sensor — Air temperature monitoring alongside wind chill and heat index calculation
↗ Humidity Sensor & Hygrometer — Relative humidity and dew point with wind direction for air mass characterization
↗ Rain Gauge — Precipitation monitoring alongside wind direction for storm tracking and front passage documentation
Related Instruments & Cluster Pages
Barometric pressure is one component of the complete cyclonePort weather surveillance platform. The following cluster pages expand on topics introduced in this pillar:
↗ What Is High Barometric Pressure? — Regional thresholds, extreme records, weather patterns, and heat dome risk [cluster page]
↗ What Is Low Barometric Pressure? — Storm systems, hurricane pressure scales, and severe weather thresholds [cluster page]
↗ What Is Normal Barometric Pressure? — Sea-level standard, regional norms, and daily cycles [cluster page]
↗ What Factors Affect Barometric Pressure? — Elevation, temperature, topography, indoor/outdoor, humidity, and diurnal cycles [cluster page]
Related instrument pages:
↗ Temperature Sensor — Air temperature and heat index monitoring [link]
↗ Humidity Sensor & Hygrometer — Relative humidity and dew point [link]
↗ Wind Meter & Anemometer — Wind speed and direction for storm assessment [link]
↗ Rain Gauge — Precipitation monitoring alongside pressure for complete storm documentation [link]
↗ Lightning Detection System — Lightning monitoring and automated alerting [link]
↗ WBGT Monitor & Heat Stress Sensor — Heat stress monitoring and outdoor safety [link]






Built for Severe Weather
Remote system management from anywhere
Deploy high-quality PTZ (Pan-Tilt-Zoom) IP cameras designed for effortless setup and immediate operation through plug-and-play simplicity. This advanced design significantly reduces installation time and complexity, making sophisticated surveillance accessible for businesses of all sizes. Multiple cameras connect seamlessly to the network.
Remote system management from anywhere
Deploy high-quality PTZ (Pan-Tilt-Zoom) IP cameras designed for effortless setup and immediate operation through plug-and-play simplicity. This advanced design significantly reduces installation time and complexity, making sophisticated surveillance accessible for businesses of all sizes. Multiple cameras connect seamlessly to the network.
Remote system management from anywhere
Deploy high-quality PTZ (Pan-Tilt-Zoom) IP cameras designed for effortless setup and immediate operation through plug-and-play simplicity. This advanced design significantly reduces installation time and complexity, making sophisticated surveillance accessible for businesses of all sizes. Multiple cameras connect seamlessly to the network.
Remote system management from anywhere
Deploy high-quality PTZ (Pan-Tilt-Zoom) IP cameras designed for effortless setup and immediate operation through plug-and-play simplicity. This advanced design significantly reduces installation time and complexity, making sophisticated surveillance accessible for businesses of all sizes. Multiple cameras connect seamlessly to the network.
Learn From The Field

- Guides
Cal/OSHA Heat Regulations for Outdoor Workers: What California Employers Must Know
- Guides
GCSAA Lightning Safety Guidance for Golf Courses: A Complete Compliance Guide