Rain Gauge
Precision tipping-bucket precipitation measurement for professional weather surveillance networks — delivering real-time rainfall accumulation, intensity, and duration data to emergency managers, broadcast meteorologists, utility operators, and critical infrastructure teams.
Contents
01 The Instrument — What a Rain Gauge Measures and Why It Matters
02 How the cyclonePort Rain Gauge Works — Tipping-Bucket Mechanism
03 Gauge Types & Technology Comparison
04 Accuracy, Undercatch & Error Sources
05 Operational Applications — Schools, Utilities, Emergency Management & More
06 Instrument Selection Guide — Specs That Matter in the Field
07 Installation & Maintenance
08 cyclonePort Rain Gauge System — Platform, Integration & Deployment
08 Frequently Asked Questions
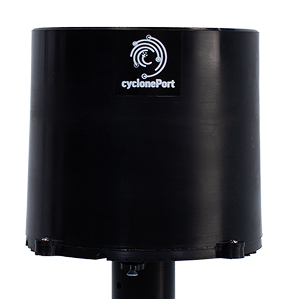

- 0.01 in / 0.2 mm
- 2% (at ≤2 in/hr)
- Pulse per tip
- RadarOmega
01 The Instrument — What a Rain Gauge Measures and Why It Matters
A rain gauge is a precision meteorological instrument that measures the quantity of liquid precipitation falling on a defined area over a specified period. It is the primary direct method for point measurement of rainfall — more precise at a given location than radar or satellite estimates, both of which interpolate precipitation over wide grid cells that can mask intense, localized events.
In the cyclonePort weather surveillance system, the rain gauge is a standard module in every station, operating alongside temperature, humidity, wind, and barometric pressure sensors. Precipitation data feeds directly into the RadarOmega platform, where it is logged, visualized, and made available in real time to operators who need ground-truth rainfall observations — not regional approximations — to make safety-critical and operationally-critical decisions.
Why point measurement matters Radar-estimated rainfall can differ from actual ground-level totals during intense convective events. A rain gauge network on your terrain, your infrastructure, or in your coverage area provides ground truth that remote sensing cannot deliver. In flash flood detection, the difference between a radar estimate and a dense gauge network can be the difference between a timely warning and a missed event. |
Rainfall data from a continuously operating, networked gauge is operationally useful in ways a periodic manual reading cannot be: it captures the onset, peak intensity, and cessation of every event in real time, contributes to historical archives for trend analysis, and supports multi-agency situational awareness during severe weather.
02 How the cyclonePort Rain Gauge Works — Tipping-Bucket Mechanism
cyclonePort weather stations use a tipping-bucket rain gauge — the most widely deployed automatic precipitation sensor in operational meteorology and hydrology worldwide. The mechanism is mechanically simple, reliable across multi-year outdoor deployments, and directly compatible with digital data logging and telemetry systems.
The Tipping-Bucket Mechanism — Step by Step
- Precipitation falls into a precision-machined funnel at the top of the gauge housing, which channels all collected water to the tipping mechanism below.
- Inside, two small calibrated catchment buckets are mounted on a fulcrum in a seesaw configuration — when one bucket fills to a precisely defined volume (typically 0.01 inches or 0.2 mm of rainfall over the collection area), it becomes overbalanced and tips.
- As the bucket tips, it empties into the outer housing and simultaneously positions the opposing bucket to begin collecting.
- Each tip actuates a sealed magnetic reed switch, sending a discrete electronic pulse to the cyclonePort data logger.
- The logger counts pulses and translates them into accumulated rainfall, rainfall rate (intensity), and event duration — all logged with a timestamp and transmitted to RadarOmega.
Signal integrity in the field cyclonePort firmware applies automated quality checks to filter spurious tip events caused by mechanical vibration, wind sway, or electrical noise — ensuring only true precipitation tips are counted and logged. |
Precision by design The catchment area of the funnel and the calibrated volume of each bucket are fixed at manufacture and verified at calibration. This means each pulse represents an exact, known depth of rainfall — no algorithmic interpretation required. Rainfall intensity (rate) is derived directly from the time interval between tips: more tips per minute = higher rainfall rate. |
What the Gauge Reports
- Accumulated rainfall (in or mm) — total precipitation since last reset or over any user-defined period
- Rainfall rate / intensity (in/hr or mm/hr) — calculated from tip frequency, updated in real time
- Event duration — continuous logging captures onset and cessation of every precipitation event
- Historical record — all data archived in RadarOmega for trend analysis, after-action review, and reporting
03 Gauge Types & Technology Comparison
Several rain gauge technologies exist, each with distinct performance characteristics, maintenance requirements, and cost profiles. Understanding the options clarifies why the tipping-bucket remains the dominant choice in professional automated weather networks.
Type | Characteristics |
|---|---|
Tipping Bucket | Widely used in automated weather networks. Rain is funneled into a small tipping mechanism in which each tip represents a fixed rainfall increment and generates an electronic pulse. Heated versions are available for cold climates. |
Strengths | Low cost, self-emptying operation, real-time digital output, and straightforward integration with data loggers. |
Limitations | Potential under-reporting during high rainfall intensities, wind-related undercatch, the need for level installation, and periodic cleaning to prevent debris-related errors. |
Weighing Gauge | Measures accumulated precipitation by continuously weighing collected water. Highly accurate across all intensities and can measure snow, hail, and mixed precipitation. Significantly higher cost, higher maintenance (must be emptied), and not self-draining. Used primarily in research, airport, and reference applications. cyclonePort can integrate compatible weighing gauges for specialized deployments. |
Strengths | Accurate at all rain rates · Can measure solid precipitation · No moving bucket mechanism |
Limitations | High cost · High maintenance · Not self-draining · May require antifreeze · Susceptible to wind-induced undercatch due to larger housing profile |
Optical / Disdrometer | Measures drop size and fall velocity optically or acoustically. Excellent for research applications requiring precipitation type discrimination (rain vs. drizzle vs. snow). No moving parts, fast response, but sensitive to optical contamination. Significantly higher cost than tipping-bucket systems. |
Strengths | No moving parts · Fast response · Can distinguish precipitation type and drop size distribution |
Limitations | High cost · Sensitive to contamination · Lower long-term reliability in unattended deployments · Less suited to broad network applications |
Standard Manual Gauge | Traditional manual rain gauge, such as the 8-inch NWS-style gauge with funnel and measuring cylinder. The reference standard for accuracy verification, but provides only periodic readings (read once per 24 hours in most networks), zero real-time capability, and requires an observer on-site. Not compatible with automated logging. |
Strengths | Highly accurate · Low cost · Reference standard for calibration |
Limitations | Not automated · No real-time data · Observer-dependent · No intensity or duration data |
04 Accuracy, Undercatch & Known Error Sources
Honest specification of a rain gauge’s accuracy requires acknowledging the sources of measurement error inherent in all above-ground precipitation instruments. Understanding these limitations is what separates professional-grade deployment from naive installation — and what guides the placement decisions and network design choices that distinguish a reliable gauge network from an unreliable one.
Wind-Induced Undercatch — The Primary Error Source
Wind-induced undercatch is the most significant and unavoidable source of error in tipping-bucket rain gauge measurements. When wind flows around the gauge housing, it creates aerodynamic turbulence above the collection orifice — deflecting raindrops away from the funnel before they can be collected. The gauge physically cannot catch rain that never enters the funnel.
The magnitude of wind-related undercatch depends on wind speed, gauge design, mounting height, shielding, and the type and size distribution of the precipitation. In general, stronger winds increase undercatch, and smaller droplets such as drizzle are affected more than large raindrops in heavy convective rain. Wind shields, including Alter-type shields, can reduce this error significantly but do not eliminate it.
Practical implication for network operators Wind-induced undercatch is systematic and predictable — it consistently produces rainfall totals that are slightly lower than actual, rather than random errors in either direction. For most operational applications (flood threshold monitoring, irrigation triggering, event documentation), the magnitude of undercatch is acceptable and well-understood. For research or regulatory applications requiring highest accuracy, wind-shielded installations and correction algorithms are available. |
High Intensity Undercatch — A Tipping-Bucket Limitation
At very high rainfall rates — typically above 2 inches per hour (50 mm/hr) — tipping-bucket gauges experience a second form of undercatch. During the brief period when the bucket is actually tipping (transitioning from full to empty), incoming rain is not being captured. At low to moderate intensities, this transition loss is negligible. At extreme convective intensities, it can produce a measurable undercount.
For many operational monitoring applications, such as flash-flood awareness, event confirmation, and situational awareness, this limitation may have limited practical impact once rainfall has already exceeded key action thresholds. However, for hydrologic analysis, research, or applications requiring the most accurate totals during intense events, the limitation should be recognized and, where necessary, addressed through instrument selection or correction methods.
Other Error Sources
- Evaporation loss: Water collected in the funnel can evaporate before tipping the bucket in hot, dry, low-humidity conditions. This effect is usually small in moderate rainfall events but can become more significant when rainfall is sparse and evaporation conditions are strong.
- Wetting loss: A small amount of water adheres to the funnel and internal surfaces instead of contributing to the measured total. In well-designed modern gauges this loss is generally small, but it can matter in very light events and when comparing high-precision totals.
- Splash-in / splash-out: Heavy drops striking near the rim can splash water in or out of the funnel. Funnel geometry and edge design affect this; professional gauges minimize it.
- Debris clogging: Leaves, insects, and other material can partially or fully obstruct the funnel. This is the primary maintenance risk in vegetated environments — addressed by periodic inspection and optional bird/debris guards.
- Leveling error: Tipping-bucket gauges must be installed level. A tilted gauge alters the bucket fill volume on one side, introducing calibration error. cyclonePort station mounts include leveling provisions.
05 Operational Applications — What Rainfall Data Enables
Flash Flood Detection and Early Warning
Rain gauges provide the most accurate method of measuring rainfall at a single geographic point, and in flash flood detection, point accuracy at the right locations is exactly what matters. Dense gauge networks allow emergency managers and forecasters to compare gauge observations against radar estimates in real time — validating or correcting radar-estimated QPE (Quantitative Precipitation Estimation) where terrain, beam blockage, or range effects degrade radar accuracy.
cyclonePort stations report tip-by-tip in real time, giving network operators the highest temporal resolution available from any ground-based precipitation instrument.
Severe Weather Analysis and Storm Documentation
Ground-level rain gauge data from a dense network reveals the spatial structure of precipitation events invisible to single-point observations or coarse-grid radar products. Knowing that one cyclonePort station recorded 2.1 inches while a neighboring station 3 miles away recorded 0.4 inches in the same 30-minute window is precisely the kind of mesoscale observation that defines storm structure, identifies high-impact corridors, and informs post-event damage assessment.
For broadcast meteorologists operating cyclonePort networks, real-time gauge data provides live on-air ground truth that differentiates their coverage from competitors relying solely on radar estimates — and allows meteorologists to accurately characterize event intensity while the event is occurring.
Utility and Infrastructure Operations
Electric utilities, transportation agencies, and stormwater management organizations use rain gauge data to make operational decisions that directly affect system reliability and public safety. Rainfall rate thresholds can help trigger vegetation management crews to stand down during active weather, inform transformer load management decisions during heat events coinciding with heavy rain, and activate stormwater infrastructure controls before downstream systems are overwhelmed.
Transportation agencies may use real-time rainfall data from distributed gauge networks to stage road crews, identify flooding-prone corridors before motorists encounter hazardous conditions, and coordinate with emergency management during weather-driven multi-agency responses.
Emergency Management — Situational Awareness and Coordination
Emergency management professionals rely on rain gauge networks for the ground-level precipitation picture that radar alone cannot deliver reliably. During active severe weather events, real-time gauge data from cyclonePort stations can display on EOC situational awareness displays — giving emergency managers the ability to track rainfall accumulation across their jurisdiction in real time, identify hotspots before 911 calls confirm them, and share data with forecasters contributing to watch/warning decisions.
Historical gauge archives from cyclonePort stations provide the after-action documentation needed for FEMA reporting, infrastructure planning, and improving future response protocols.
Schools, Athletics & Sports Venues
School districts, universities, and sports venue operators rely on on-site rainfall data for decisions that directly affect participant safety and liability: when to delay or cancel outdoor athletic events, when to activate field drainage, and when to shelter spectators. Real-time rainfall rate data from a cyclonePort gauge at the venue — not a regional forecast or airport station miles away — provides the site-specific ground truth that safety protocols benefit from. cyclonePort offers purpose-built workflows for school campuses and athletic facilities.
Industrial, Construction & Stormwater Compliance
Industrial facilities and active construction sites are subject to stormwater management and erosion control compliance requirements that mandate documented precipitation monitoring. Real-time rainfall accumulation data from an on-site gauge can support timestamped records for environmental compliance reporting — and give site managers the lead time to activate erosion controls, cover stockpiles, or pause grading operations before thresholds are exceeded. A cyclonePort gauge logging to RadarOmega provides records that manual observation cannot.
Large Venue Operators & Commercial Campuses
Stadiums, theme parks, large commercial campuses, and event venues use rainfall rate data to aid in real-time crowd safety and operations decisions: when to delay outdoor events, when to activate drainage protocols, and when to suspend crane or elevated work operations on-site. Real-time rainfall rate data from an on-site cyclonePort gauge is far more actionable than a regional forecast when the question is ‘what is happening at this location, right now.’
06 Instrument Selection Guide — Specs That Matter in the Field
For professional weather surveillance deployments, rain-gauge performance depends not only on the sensing mechanism itself, but also on collector design, calibration quality, environmental exposure, maintenance accessibility, and data integration. The specifications below have the greatest practical impact in the field.
Specification | What to Require |
|---|---|
Resolution | 0.01 inches (0.254 mm) or 0.2 mm per tip — the WMO-recommended standard for automated gauges. Coarser resolution (0.1 in per tip) is acceptable for long-accumulation monitoring but misses the intensity detail needed for flash flood and storm analysis applications. |
Collection Orifice Area | Larger collection areas improve measurement of low-intensity precipitation and reduce the relative impact of wetting loss. Standard professional gauges use 200 cm² (WMO recommendation) or 8-inch diameter funnels matching NWS specifications. |
Accuracy Rating | ±2% at rainfall rates up to 2 in/hr (50 mm/hr) is the standard for professional-grade tipping-bucket gauges. Verify this specification is stated at rated rainfall intensity — not just at the laboratory test rate. Accuracy degrades at higher intensities in all tipping-bucket designs. |
Funnel & Housing Materials | UV-resistant, non-wetting materials minimize evaporation loss and wetting loss errors. Stainless steel or engineered polymer funnels perform better over long deployments than painted aluminum, which can corrode and create surface roughness that increases wetting losses. |
Heated Option | For deployments in climates where below-freezing temperatures are expected, a heated gauge prevents funnel and mechanism freezing — enabling measurement of snow, sleet, and freezing rain as liquid water equivalent. Essential for year-round monitoring in northern latitudes or high-elevation sites. |
Leveling Provision | Professional gauges include built-in leveling screws and a bubble level indicator. Level installation is non-negotiable for tipping-bucket accuracy — a tilted gauge alters bucket fill volume on one side and introduces systematic calibration error. |
Output & Connectivity | Verify the gauge outputs a standard reed-switch pulse compatible with the data logger and platform. Confirm configurable logging intervals (1-minute resolution or better for intensity calculations) and real-time telemetry via cellular, Wi-Fi, or Ethernet. |
Wind Shielding | For sites with sustained wind exposure, an Alter-type slatted wind screen reduces undercatch significantly. Factor installation requirements into site planning for open terrain, rooftop, and coastal deployments. |
Network Integration | A rain gauge that logs to an isolated display delivers a number. A networked rain gauge delivers data — timestamped, historically archived, and accessible alongside all other sensor streams from the same platform. |
Maintenance Access | Self-emptying mechanism is essential for unattended deployments. Verify the funnel and mechanism are accessible for periodic cleaning without specialized tools. |
07 Installation & Maintenance
Proper siting is the single highest-leverage factor in rain gauge accuracy. A well-calibrated instrument in a poorly chosen location consistently produces worse data than a standard instrument correctly sited. cyclonePort provides station-specific installation guidance, but these principles apply universally.
Siting Best Practices
- Clear horizontal exposure: WMO guidelines recommend surrounding obstructions be no closer than 10 times their height above the gauge orifice — a 30-foot tree should ideally be at least 300 feet away. At an absolute minimum, obstructions should be no closer than twice their height. The more open the exposure, the more representative the reading.
- Level installation: Use built-in leveling screws and bubble indicator to set the gauge precisely level on all axes. Even a 1–2° tilt introduces measurable calibration error in tipping-bucket designs.
- Avoid rooftops where possible: Wind deflection and turbulence at rooftop edges reduce precipitation catch compared to open-ground installations. Where rooftop mounting is unavoidable, center the gauge away from parapet edges, HVAC equipment, and any structure that creates upward airflow or condensate drip.
- No overhead obstructions: Trees directly overhead intercept precipitation before it reaches the gauge (canopy interception), and branch drip after rain cessation produces false post-event readings. Open sky above the orifice is required.
- Mounting height: Gauge orifice typically 1–2 meters above ground. Higher mounting increases wind exposure and undercatch; lower mounting increases splash-in risk during heavy events.
- Consider wind shielding: For sites with sustained wind exposure — open fields, coastal locations, hilltops — an Alter-type slatted wind shield significantly reduces undercatch without impeding precipitation entry.
Typical installation time Under one hour with standard tools. cyclonePort supplies mounting hardware for pole mounts, wall brackets, and rooftop masts. Level mounting surface or adjustable mount required for all tipping-bucket installations. Contact our team for site-specific siting guidance. |
Calibration
cyclonePort rain gauges are factory-calibrated to verify the bucket tip volume matches specification before shipping. Calibration establishes the exact rainfall depth per tip, which determines the relationship between pulse count and measured accumulation.
Field verification using a measured volume of water poured at a controlled rate through the funnel allows operators to confirm the tip count matches expected accumulation. For critical applications — stormwater management, regulatory reporting, research — annual verification using a calibrated laboratory flow source is recommended.
Routine Maintenance
- Funnel inspection: Clear leaves, spider webs, insects, and debris from the funnel and collection orifice at least seasonally, or more frequently in vegetated environments. A partially obstructed funnel produces chronically low readings.
- Bucket mechanism check: Visually confirm the tipping bucket moves freely on its pivot — no debris, corrosion, or spider webs restricting motion. A bucket that tips sluggishly or not at all produces no data for that event.
- Reed switch and cable check: Confirm the pulse cable connection is secure and weatherproof. Intermittent connections produce missing tips and false zero readings.
- Housing inspection: Check mounting hardware, housing integrity, and any debris screens for physical damage annually or after severe weather events.
- Long-term verification: Tipping-bucket gauges should be inspected and periodically verified, especially in critical applications. Cleaning, leveling checks, and field verification are part of good maintenance practice.
When to Contact Support
Contact cyclonePort support if: the gauge consistently reads zero precipitation during observed rain events (debris clog, mechanism failure, or cable fault); gauge accumulation totals persistently differ from nearby reference stations by more than expected microclimate variation; or individual tip events appear erratic in the RadarOmega data logs (intermittent reed switch contact).
08 cyclonePort Rain Gauge System
The rain gauge is a standard module in every cyclonePort weather surveillance station, feeding precipitation data directly into the RadarOmega cloud platform alongside wind, temperature, humidity, dew point, and barometric pressure from the same station.
Technical Specifications
Parameter | Specification |
|---|---|
Gauge Type | Tipping-bucket with calibrated reed-switch pulse output |
Collection Orifice | 200 cm² (WMO-compliant) / 8-inch diameter (NWS-specification equivalent) |
Resolution | 0.01 in (0.254 mm) per tip — standard; 0.2 mm per tip — metric models |
Accuracy | ±2% at rainfall rates ≤2 in/hr (50 mm/hr) |
Max Measurable Rate | Effectively unlimited accumulation; intensity accuracy degrades above 2 in/hr |
Operating Temp | –40°C to +60°C standard; heated models available for below-freezing operation |
Heated Option | Available — enables snow/sleet/freezing rain measurement as liquid water equivalent |
Output | Reed-switch pulse; one pulse per tip; integrated into cyclonePort data logger |
Logging Interval | Tip-timestamped (event-driven) + configurable summary intervals (1–5 min) |
Data Transmission | Cellular, Wi-Fi, or Ethernet depending on station model |
Data Access | Web portal, mobile app, REST API via RadarOmega |
Export Formats | CSV and JSON; |
Alerts | Real-time SMS/email when hourly or cumulative accumulation thresholds are crossed |
Power Input | Low-voltage DC, 5–12V (under 50mA); reed switch draws microamp-range current |
Power Compatibility | Solar-compatible; PoE (Power over Ethernet) supported depending on station model |
Connectivity Output | Reed-switch pulse to cyclonePort logger; IP network, RS485/Modbus serial also available |
Environmental Rating | IP65+ — dust-tight and protected against water jets; suitable for all-weather outdoor deployment |
Housing Materials | UV-stable engineering polymer and stainless steel hardware; corrosion-resistant for long-term outdoor exposure |
Optional Accessories | Bird guard · 0.5mm insect mesh screen · Alter-type wind shield · Heated collector (100–200W) for frozen precipitation |
Power | Ultra-low (reed switch — microamp range); compatible with solar station power |
Specifications may vary by model. Contact cyclonePort for current engineering documentation.
What the System Delivers
- Real-time rainfall accumulation — total precipitation updated with every bucket tip, timestamped and logged
- Rainfall intensity (rate) — calculated from tip frequency in real time; displayed in in/hr or mm/hr
- Event duration — onset, peak, and cessation of every precipitation event captured with timestamp precision
- Historical data archive — full tip-level log accessible in RadarOmega for trend analysis, after-action review, and reporting
- Multi-station comparison — view rainfall simultaneously across your entire network to map event spatial structure
- PTZ camera integration — correlate live video with gauge data at every station for visual event documentation
- Remote access — all data accessible from any location via RadarOmega
Who Deploys cyclonePort Rain Gauges
Sector | What cyclonePort Enables |
|---|---|
Emergency Management | Real-time accumulation and intensity monitoring for flash flood detection, flood threshold awareness, and post-event damage documentation. Multi-agency data sharing built into the platform. |
Broadcast Media | Live gauge data for on-air ground truth during storm coverage. Display real measured accumulation from your coverage area — not radar estimates — while events are ongoing. |
Utilities & Power | Rainfall rate data for line crew staging, vegetation management timing, stormwater infrastructure control, and infrastructure protection decisions ahead of storm passages. |
Schools & Athletics | Site-specific rainfall data for outdoor event safety decisions, athlete protection protocols, and weather-dependent activity management. Built for school campuses, stadiums, and sports complexes. |
Industrial & Construction | On-site precipitation logging for stormwater management compliance, erosion control documentation, and environmental reporting. |
Venues & Commercial | Real-time rainfall rate for crowd safety decisions, drainage protocol activation, and suspended operations management at stadiums, campuses, and large event facilities. |
Deploy Rain Gauge Monitoring at Your Site cyclonePort scales from a single station to large multi-location precipitation networks. Contact our team to configure the right deployment — hardware, mounting, telemetry, and platform integration. info@cycloneport.com · 844-737-9328 · cycloneport.com/contact |
09 Frequently Asked Questions
What is a rain gauge and how does it work?
A rain gauge measures the amount of liquid precipitation that falls on a defined collection area over time. In automated tipping-bucket gauges, each tip represents a fixed increment of rainfall and is recorded electronically to calculate accumulation and rainfall rate.
What is the difference between a rain gauge and a weather radar for measuring rainfall?
A rain gauge directly measures precipitation at one point on the ground, while radar estimates rainfall over larger areas based on reflected energy from precipitation aloft. Gauges are essential for validating and refining radar estimates.
What is tipping-bucket undercatch and how significant is it?
Undercatch is when a gauge records less rain than actually fell, often because wind distorts airflow around the collector. Tipping-bucket gauges can also under-register during very intense rainfall. The size of the error depends on exposure, wind, gauge design, and rainfall characteristics.
What is rainfall intensity and how is it calculated from a tipping-bucket gauge?
How accurate is a professional tipping-bucket rain gauge?
A well-installed professional tipping-bucket gauge can provide very good automated point rainfall data, but real-world performance depends on calibration, siting, wind exposure, leveling, maintenance, and rainfall intensity.
Does a rain gauge measure snow?
A standard unheated tipping-bucket gauge does not measure snow reliably. Heated gauges can measure frozen precipitation as liquid water equivalent, though performance depends on design and conditions.
How often does a tipping-bucket rain gauge need to be calibrated?
Tipping-bucket gauges should be inspected and periodically verified, especially in critical applications. Cleaning, leveling checks, and field verification are part of good maintenance practice.
Can I compare my cyclonePort gauge readings to nearby NWS or airport stations?
Yes. Comparing to nearby trusted stations is a useful quality check, but local rainfall differences over short distances are common, especially in convective weather.
Related Instruments & Guides
The rain gauge is one of several precision instruments in the cyclonePort weather surveillance system. Explore related instrument pages:
↗ Humidity Sensor & Hygrometer — Relative humidity, dew point, and atmospheric moisture monitoring [link]
↗ Wind Speed & Direction Sensor (Anemometer) — Wind measurement for severe weather monitoring and site safety [link]
↗ Barometric Pressure Sensor — Pressure monitoring for storm tracking and weather pattern analysis [link]
↗ Temperature Sensor — Air temperature measurement and heat index / WBGT calculation [link]






Built for Severe Weather
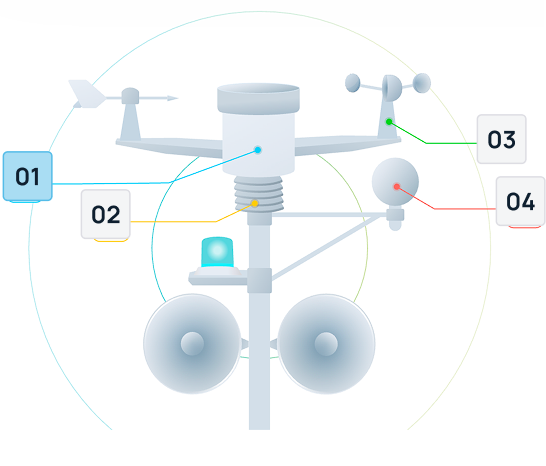
Remote system management from anywhere
Deploy high-quality PTZ (Pan-Tilt-Zoom) IP cameras designed for effortless setup and immediate operation through plug-and-play simplicity. This advanced design significantly reduces installation time and complexity, making sophisticated surveillance accessible for businesses of all sizes. Multiple cameras connect seamlessly to the network.
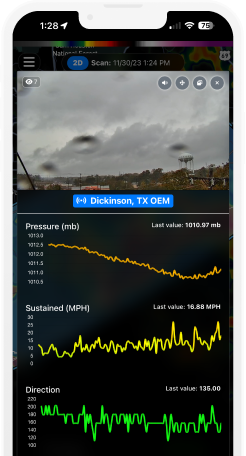
Remote system management from anywhere
Deploy high-quality PTZ (Pan-Tilt-Zoom) IP cameras designed for effortless setup and immediate operation through plug-and-play simplicity. This advanced design significantly reduces installation time and complexity, making sophisticated surveillance accessible for businesses of all sizes. Multiple cameras connect seamlessly to the network.
Remote system management from anywhere
Deploy high-quality PTZ (Pan-Tilt-Zoom) IP cameras designed for effortless setup and immediate operation through plug-and-play simplicity. This advanced design significantly reduces installation time and complexity, making sophisticated surveillance accessible for businesses of all sizes. Multiple cameras connect seamlessly to the network.
Remote system management from anywhere
Deploy high-quality PTZ (Pan-Tilt-Zoom) IP cameras designed for effortless setup and immediate operation through plug-and-play simplicity. This advanced design significantly reduces installation time and complexity, making sophisticated surveillance accessible for businesses of all sizes. Multiple cameras connect seamlessly to the network.