Weather Monitoring for Emergency Management Agencies

Equip your EOC with real-time, hyper-local weather data for faster, better-coordinated emergency response

Emergency management professionals know that regional weather data is a blunt instrument. When a tornado watch covers three counties, your EOC needs to know which township is seeing rotation. When a flash flood warning is issued, your field teams need to know which road crossings have current precipitation intensity — not where the storm was 20 minutes ago when the model ran. cyclonePORT gives emergency management agencies the real-time, on-site weather intelligence to coordinate faster, resource more efficiently, and document more thoroughly.

We map your organization’s needs.

Plug-and-play hardware goes live.
Real-time data flows to your command center.

Why Emergency Management Agencies Choose cyclonePORT

County and municipal Emergency Management Directors choose cyclonePORT because it fills the gap between regional NWS data and the hyper-local intelligence their operations actually require:

  • EOC-ready data: Real-time sensor data from multiple deployed units feeds directly into the EOC dashboard — displayable on ops screens and accessible to all desk officers simultaneously.
  • Lightning detection: Real-time lightning data for field crew and volunteer safety, search and rescue coordination, and shelter activation triggers.
  • Wind monitoring: Track wind speeds at key locations — bridges, flood-prone corridors, critical facilities — during major weather events.
  • Precipitation data: Real-time rain gauge data from deployed units across the jurisdiction for flood and runoff modeling.
  • Field deployment: Solar-powered, wireless units can be deployed to disaster sites, staging areas, or flood corridors within hours of event onset.
  • Incident documentation: Automatic timestamped logging supports FEMA Public Assistance documentation, after-action reports, and State Emergency Management reporting requirements.

From Mitigation to Recovery — cyclonePORT Supports the Full EM Cycle

Preparedness: Deploy sensors at known high-risk locations before hazard season.

Response: Real-time field data supports resource deployment and field crew safety during active events.

Recovery: Timestamped data logs support FEMA Public Assistance documentation and after-action analysis.

Mitigation: Historical data from deployed units informs infrastructure and community risk reduction planning.

What You're Monitoring

cyclonePORT captures all primary weather variables relevant to emergency management operations:

Specification

Detail

Lightning Detection

Real-time proximity alerts — field crew safety and shelter activation support

Wind Speed & Direction

Continuous monitoring — road closures, structure risk assessment

Precipitation (Rain Gauge)

Real-time rainfall intensity — flood monitoring and runoff correlation

Temperature & Humidity

Heat emergency monitoring and field personnel safety

Wet Bulb Temperature

Heat illness risk for field responders during extended operations

Barometric Pressure

Storm system tracking — advance warning of rapidly changing conditions

Data Logging

Continuous timestamped archive — FEMA PA documentation and after-action reporting

Multi-Site Dashboard

All deployed units visible in one EOC operational display


Capabilities

Built for Severe Weather

Harness advanced meteorological technology to track atmospheric conditions with precision. Our weather surveillance system provides instant alerts and detailed forecasts to keep you prepared. Real-time data from multiple sensors and satellites delivers actionable insights for informed decisions. Our platform combines historical patterns with current measurements for reliable forecasts.
01 Anemometer 02 PTZ Camera 03 Rain Gauge 04 Primary Sensor Housing 05 Wet Bulb Globe 06 CyclonePORT Hub
01.

The Pulse of the Sky

The anemometer is the “nervous system” of our weather stations. Moving beyond old-fashioned mechanical cups, our hardware utilizes ultrasonic sensor arrays to measure the velocity and direction of the wind. By calculating the time it takes for sound pulses to travel between sensors, it provides a lag-free, high-definition map of air movement.

02.

The PTZ Observation Unit

Our PTZ units are ruggedized optical sensors designed to withstand the very conditions they are monitoring. These aren’t just for recording video; they serve as a critical layer of visual ground-truthing. When our sensors detect a change in wind speed or pressure, the PTZ camera can automatically swivel to the point of interest—allowing us to see the formation of wall clouds, debris, or precipitation in real-time.

The lens moves vertically, allowing for a look at both high-altitude cloud formations and ground-level impacts

03.

Liquid Precision: 
The Smart Rain Gauge

The rain gauge is the primary component for measuring precipitation intensity and accumulation. Our systems typically utilize “Tipping Bucket” or “Optical” technology to provide high-resolution data. As droplets enter the collector, the sensor logs the volume in real-time, allowing our AI to calculate rainfall rates per minute.

04.

Resilience by Design: 
The Primary Sensor Housing

The Primary Sensor Housing is the ruggedized enclosure that integrates and protects the suite of meteorological instruments. It isn’t just a box; it is a precision-engineered environment. Designed with aerodynamic stability and thermal regulation, it ensures that internal components—like barometers, data loggers, and transmission hardware—stay dry, cool, and connected even in hurricane-force winds or sub-zero blizzards.

05.

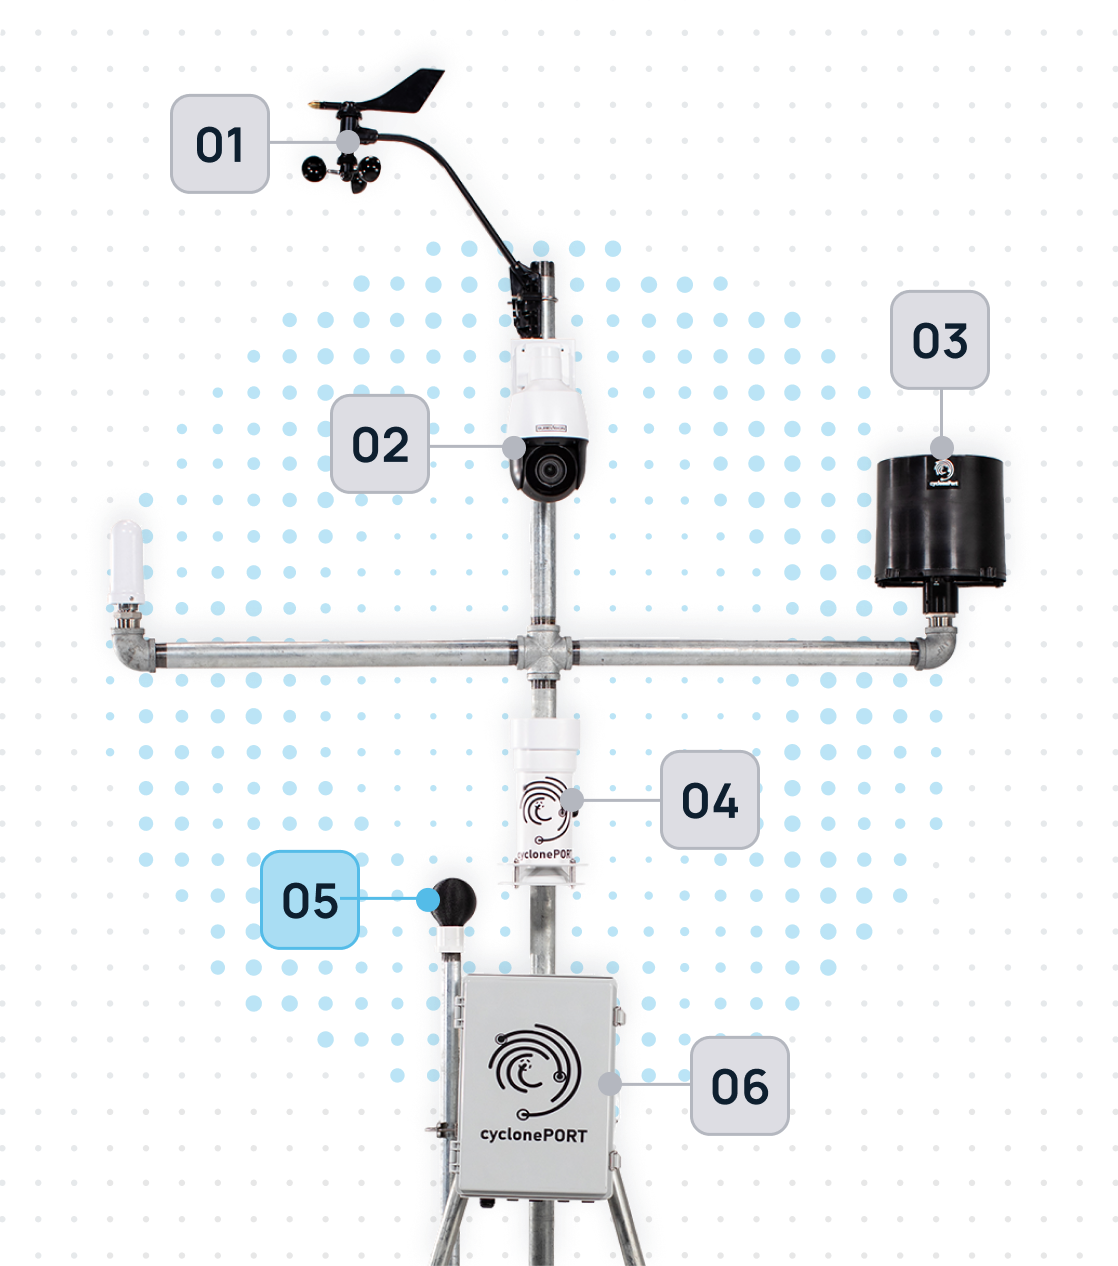
Human-Centric Heat Intelligence

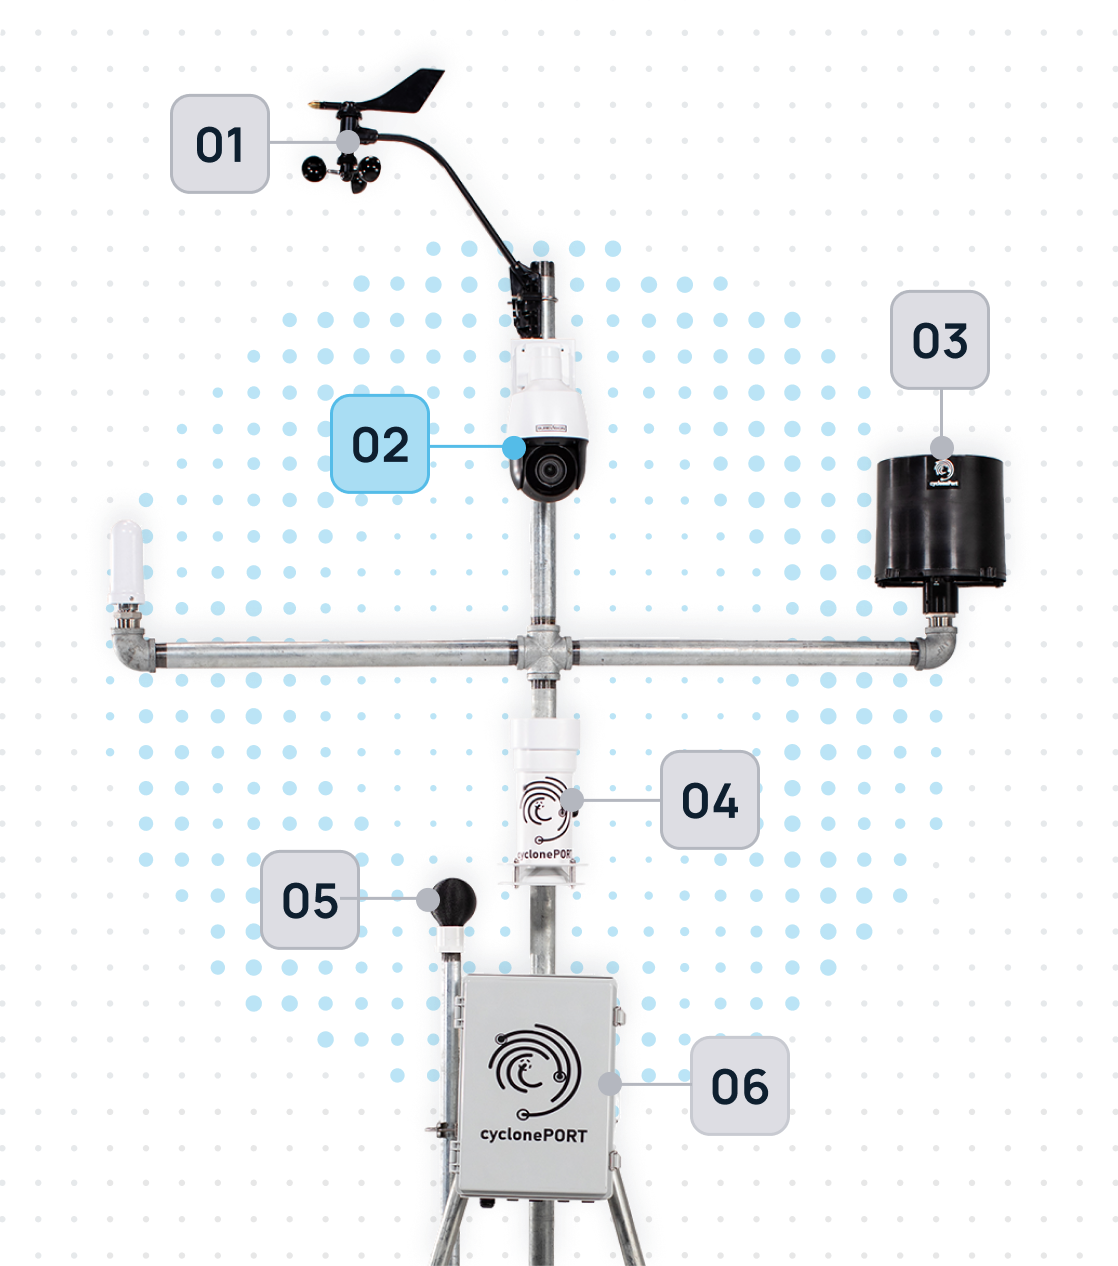
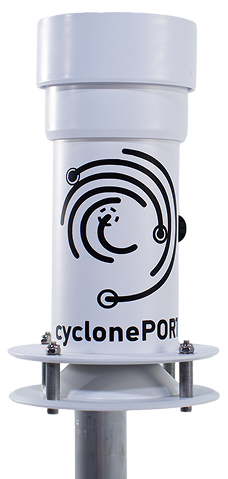
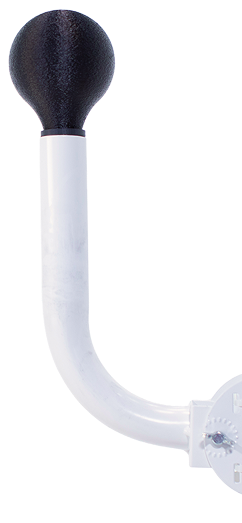
The Wet Bulb Globe is the “biometric” sensor of our weather stations. It doesn’t just measure ambient air; it accounts for the three-way punch of temperature, humidity, and solar radiation. By simulating how a human being absorbs heat while sweating in direct sunlight, it provides the Wet Bulb Globe Temperature (WBGT)—the most accurate metric for predicting heat exhaustion and sunstroke.

For companies managing outdoor crews, sports events, or high-load data centers, this sensor is the definitive “go/no-go” signal for safety.

06.

The Intelligence Engine: CyclonePORT Hub

The CyclonePORT Hub is the central nervous system of our weather monitoring architecture. It serves as the high-speed bridge between raw environmental data and actionable cloud intelligence. While our sensors are busy “feeling” the storm, the Hub is busy translating those signals, encrypting the data, and ensuring it reaches our forecasting models in milliseconds—even when local power grids or traditional networks fail.

It is designed for “Edge Computing,” meaning it processes critical data locally to provide instant alerts before the information even hits the cloud.

Platform Features at a Glance

Specification

Detail

Deployment

Permanent EOC/facility mount + rapid-deploy field configuration

Power

Solar + battery backup — independent of grid, operational during power outages

Connectivity

Cellular or satellite — maintains data transmission during infrastructure disruption

EOC Integration

Multi-unit dashboard displayable on EOC operations screens

Alert System

Configurable threshold alerts for lightning, wind, precip, and heat

Documentation

Automatic timestamped logging — FEMA PA and after-action report support

FEMA, NWS & State EM Standards Alignment

cyclonePORT supports alignment with the federal and state standards that govern emergency management weather operations:

  • FEMA Public Assistance (PA) documentation requirements — weather event data logging
  • NIMS (National Incident Management System) — ICS weather data and situational awareness protocols
  • NWS SKYWARN and CoCoRaHS cooperative observation network compatibility
  • State Emergency Management Division weather monitoring and reporting requirements
  • OSHA weather safety requirements for emergency response personnel

Network Your Entire Jurisdiction

cyclonePORT’s multi-site platform allows EMAs to deploy units at high-risk locations across the entire jurisdiction — flood corridors, community shelters, critical facilities — and monitor all locations from the EOC dashboard simultaneously.

Solar-powered units with cellular connectivity require no infrastructure investment at deployment sites.

Common Use Cases

EOC Situational Awareness

A network of cyclonePORT units deployed across a county or municipal jurisdiction feeds real-time, hyper-local weather data to the EOC dashboard during an active event. Emergency managers and desk officers see wind speeds at the bridges, precipitation at the flood corridors, and lightning proximity at the staging areas — all simultaneously, on a single screen.

Rapid Field Deployment During Events

When a tropical system makes landfall, a tornado outbreak occurs, or a wildfire develops rapidly, cyclonePORT’s solar-powered, wireless units can be transported and deployed at critical locations within hours. Field data is transmitted to the EOC in real time without requiring communications infrastructure at the deployment site.

Post-Event FEMA Documentation

FEMA Public Assistance reimbursement requires documentation of the scope and intensity of declared disaster events. cyclonePORT’s automatic data logging provides timestamped records of precipitation, wind speeds, and other weather parameters that can directly support PA project worksheets and disaster documentation packages.

Results

When Seconds Decide Outcomes

Our real-world projects demonstrate strategic direction translating into measurable impact. Through documented client successes, we showcase tangible outcomes—from enhanced efficiency to transformed business results. These authentic stories reveal how our solutions address specific challenges, adapt to unique circumstances, and empower organizations to achieve their goals. Each case study represents proven expertise in action.

A county emergency management agency detected rotation

Live video feeds from cyclonePORT stations caught the storm’s development before radar confirmation. Real-time wind data and pressure readings gave forecasters the intelligence needed to issue warnings minutes earlier than traditional methods allowed.

Emergency crews coordinated faster with shared data

When the warning went out, first responders already had access to the same video feeds and sensor data as the emergency operations center. Utility crews knew exactly where to position equipment. Fire departments staged resources based on confirmed wind speeds rather than estimates.

Frequently Asked Questions

Can cyclonePORT units be deployed quickly during an emerging emergency?

Yes. cyclonePORT’s solar-powered, wireless field configuration can be transported and operational within a few hours of arrival at a deployment site. Cellular connectivity means no infrastructure is required at the deployment location.

cyclonePORT automatically logs all sensor readings with timestamps throughout an event. This data record can document the timing, intensity, and geographic distribution of weather conditions at deployed unit locations — directly useful for FEMA PA project documentation.

Yes. cyclonePORT’s multi-site dashboard is web-based and can be displayed on any screen or monitor in the EOC. Contact our team about integration with situational awareness platforms and GIS systems.

cyclonePORT supports multi-organization data sharing. During regional events requiring mutual aid coordination, adjacent EMAs can be granted access to view real-time data from each other’s deployed units — improving regional situational awareness.

Build the Hyper-Local Weather Intelligence
Your EOC Needs

Contact our team about multi-unit EMA deployments, EOC integration, and FEMA documentation support.

cycloneport.com/contact  |  info@cycloneport.com  |  844-737-9328