Data Logging Weather Station & Weather Data Services
Continuous, timestamped weather data logging built into every cyclonePort station — capturing temperature, humidity, wind, pressure, rainfall, lightning, heat index, and WBGT every second, storing it in the cloud.
Contents
01 What Is a Weather Station Data Logger?
02 How cyclonePort Data Logging Works — From Sensor to Cloud Archive
03 What Gets Logged — Every Sensor, Every Second
04 Weather Data Logging Software — The RadarOmega Platform
05 The Archive — Why Historical Weather Data Is Your Most Valuable Asset
06 Compliance and Regulatory Documentation
07 Forensic Weather Reconstruction — Data Logging for Legal and Insurance Use
08 API and Integration — Connecting Weather Data to Your Systems
09 Data Export — CSV, JSON, and Scheduled Reports
10 Who Uses cyclonePort Data Logging
11 System Specifications
12 Frequently Asked Questions

- Every second
- Full archive
- RadarOmega
01 What Is a Weather Station Data Logger?
A weather station data logger is the component of a weather monitoring system that captures, timestamps, stores, and transmits the readings from every connected sensor at regular intervals — automatically, continuously, and without human intervention.
In a cyclonePort weather monitoring system, Modern cloud-connected weather stations like cyclonePort integrate the data logger function into the station’s onboard processor, transmitting every reading in real time to a secure cloud archive where it is accessible from any device.
Data logging is not just storage — it is the foundation for everything else. Real-time alerts require a current reading to compare against a threshold. Trend analysis requires a history of readings over time. Compliance documentation requires a timestamped record of conditions during a regulated activity. Insurance claims require proof of what conditions were at your location on a specific date and time. Post-incident investigation requires a second-by-second reconstruction of what happened before, during, and after an event. None of these functions exist without data logging. The sensor that measures but does not log is operationally incomplete. |
cyclonePort integrates data logging as a core system function — not an add-on. Every sensor reading is captured every second, assigned a precise GPS-referenced timestamp, stored in the RadarOmega cloud archive, and simultaneously displayed on live dashboards, evaluated against alert thresholds, and made available for API pull and bulk export. The archive begins the moment the station goes online and continues without interruption for the lifetime of the deployment.
02 How cyclonePort Data Logging Works — From Sensor to Cloud Archive
cyclonePort data logging operates in four sequential stages that run continuously every second the station is powered:
| Stage | What Happens |
|---|---|
| 1. Sample | Every sensor in the station samples its respective atmospheric parameter at the configured interval (default: every 1 second). The onboard processor reads the raw electrical signal from each sensor and applies factory-calibrated conversion coefficients to produce a calibrated physical measurement — °F/°C for temperature, % for humidity, m/s or mph for wind speed, hPa for pressure, and so on. |
| 2. Compute | The processor applies quality control checks — comparing each reading against physically plausible bounds and flagging step changes that exceed sensor response physics. Derived metrics are calculated in real time: heat index (NWS Rothfusz formula), wind chill (NWS 2001 formula), dew point, and WBGT where applicable. All computed values are added to the log record alongside the raw sensor readings. |
| 3. Transmit | The complete record — all sensor readings plus derived metrics — is formatted with a precise UTC timestamp and transmitted to the RadarOmega cloud platform via the station’s cellular (4G LTE), WiFi, or Ethernet link. If connectivity is temporarily interrupted, readings are buffered locally and transmitted when the connection is restored, ensuring no data gaps in the archive. |
| 4. Archive & Distribute | The RadarOmega platform ingests each record, writes it to the permanent cloud archive with geographic metadata (GPS coordinates, elevation, station ID), and simultaneously distributes the reading to: live dashboards for current-conditions display, alert evaluation engines for threshold comparison, API endpoints for third-party system pull, and scheduled report generation queues. |
What happens when connectivity drops cyclonePort stations buffer sensor readings locally when cellular or network connectivity is temporarily unavailable. When connectivity is restored, the buffered records are transmitted to the cloud archive in sequence, filling any gap that occurred during the outage. The archive is designed as a continuous, unbroken record — not a collection of online sessions with gaps during outages. This is critical for compliance documentation and forensic reconstruction, where gaps in the data record create defensibility problems. |
03 What Gets Logged — Every Sensor, Every Second
Every parameter measured by the cyclonePort station is logged continuously. This is the complete data record available in the archive:
| Parameter | What Is Logged |
|---|---|
| Timestamp | UTC timestamp with local timezone conversion. Precision to the second. All records geo-referenced to the station’s GPS coordinates and elevation. |
| Air Temperature | Dry bulb temperature in °F and °C. The primary input for all derived thermal comfort metrics. |
| Relative Humidity | Atmospheric moisture percentage. Combined with temperature for heat index and dew point calculation. |
| Dew Point | Calculated continuously from temperature and humidity. Logged alongside raw inputs. |
| Heat Index | NWS Rothfusz formula with adjustments. Logged with NWS risk category label at each observation. |
| Wind Speed | Instantaneous and 2-minute sustained speed. Peak gust speed and gust timestamp within each logging interval. Units configurable (m/s, mph, knots). |
| Wind Direction | Vector-averaged compass bearing in degrees from true north. Logged alongside instantaneous direction. |
| Wind Chill | NWS 2001 formula. Logged when temperature ≤50°F and wind speed >3 mph. Includes frostbite risk category. |
| Barometric Pressure | Absolute pressure (hPa) and sea-level-equivalent pressure. Trend rate (rising/falling hPa per hour) computed and logged. |
| Rainfall | Instantaneous precipitation rate and cumulative totals (per hour, per day, per event, since reset). Tipping-bucket resolution. |
| Lightning | Each detected strike: timestamp, distance in miles/km, bearing (where applicable). Proximity status (within alert thresholds) logged continuously. |
| WBGT | Where WBGT sensor installed: wet bulb globe temperature, dry globe temperature, natural wet bulb temperature. GHSA/NFHS/NCAA risk category logged at each observation. |
| Solar Radiation / UV | Where sensor installed: incoming solar irradiance (W/m²) and UV index. Input for evapotranspiration calculation. |
| Sensor Health | Per-sensor status flags: calibration status, quality control flags, communication status. Enables post-hoc data quality assessment. |
| Camera Events | Where PTZ camera installed: timestamped image captures at configurable intervals. |
04 Weather Data Logging Software — The RadarOmega Platform
cyclonePort’s weather data logging software is RadarOmega — the weather platform for everyday users and professionals that also powers broadcast meteorology, university weather programs, emergency management operations, and more. Every cyclonePort station’s data logs directly into the RadarOmega platform, where sensor data and live camera feeds are accessible from a single interface.
Live Data Display
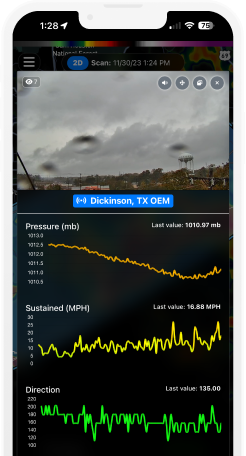
Current sensor readings from every connected station display in real time on the RadarOmega station dashboard: temperature, humidity, heat index, wind speed and direction, pressure, rainfall, lightning proximity, and WBGT — updated every second. Trend sparklines show the direction and rate of change for each parameter over a given time period, giving operators immediate context for current readings without requiring them to pull up historical charts.
Historical Chart Viewer
The RadarOmega chart viewer provides robust exploration of the historical data archive with the following capabilities:
- Multi-parameter overlay: Plot temperature, humidity, wind, pressure, rainfall, or any derived metric simultaneously on the same time axis — revealing correlations and patterns that single-parameter views cannot.
- Configurable time windows: View data from the station over a selected time interval.
- Threshold visualization: Overlay NWS heat index danger levels, GHSA/NFHS WBGT categories, OSHA heat trigger thresholds, or any custom threshold line on the historical chart to visualize how often and for how long conditions exceeded safety limits.
- Event annotation: Tag specific events — a weather delay, a heat illness incident, a storm — in the historical chart for rapid reference during after-action reviews or litigation discovery.
- Extremes summary: Daily and period maximum/minimum values for all parameters, with exact timestamps. What was the hottest hour? What was the peak gust during the storm? What was the 10-minute average wind direction when the lightning delay was called?
Alert Engine
The RadarOmega alert engine evaluates every incoming sensor reading against all configured threshold rules and triggers notifications within seconds when conditions cross a threshold. Alert configurations are stored and logged alongside the sensor data — creating a complete record of not just what conditions were, but what notifications were sent and when. This alert audit trail is a key component of compliance documentation.
Scheduled Reporting
RadarOmega can deliver automated weather reports on any schedule — daily, weekly, or triggered by specific events — to defined recipient lists via email. Scheduled reports can include: daily weather summaries (high/low temperature, peak gust, rainfall total, lightning events, hours above WBGT or heat index thresholds); weekly compliance summaries for athletic or construction operations; and post-event reports triggered by alert activations. These automated reports eliminate the manual logging and reporting burden that compliance with state athletic association weather policies would otherwise require.
05 The Archive — Why Historical Weather Data Is Your Most Valuable Asset
When organizations first deploy a weather monitoring station, they typically focus on real-time capability: the alert that fires when lightning is at 8 miles, the heat index display that drives practice modification decisions, the wind speed reading that determines crane operation status. These real-time functions are important. But the longer a cyclonePort station has been deployed, the more valuable its archive becomes.
The Archive as Compliance Record
Most organizations that monitor weather for safety compliance face a documentation requirement: they must demonstrate that they were monitoring conditions at the times and locations where regulated activities occurred, and that they took appropriate action when conditions exceeded policy thresholds. Manual logging — a coach with a clipboard, readings every 15 minutes from a handheld device — creates gaps, requires staff time, and is vulnerable to inconsistency and error.
cyclonePort’s continuous automated log provides something manual logging cannot: an unbroken record of atmospheric conditions at the facility that requires no human action to generate. When audited for WBGT records during fall football practice, or when OSHA inspects heat safety records for an outdoor worksite, the cyclonePort archive provides a timestamped record with no reliance on staff memory or manual notation.
How regulatory bodies define adequate documentation Most state athletic associations require that schools document weather monitoring during outdoor athletic activities, with WBGT readings recorded at specified intervals during practice and competition. cyclonePort logs WBGT continuously, with the ability to generate interval charts. The difference between manual recording and automated logging is the difference between a compliance requirement that burdens staff every practice day and one that runs itself. |
The Archive as Liability Shield
When a weather-related incident occurs — a heat illness during practice, a lightning injury during a school event, a crane failure in high winds, a slip-and-fall during a storm — the first question in every subsequent investigation is: what were the weather conditions at that specific location at the time of the incident? The second question is: what did the responsible party know, when did they know it, and what action did they take?
An organization with a cyclonePort station can answer both questions precisely. The archive provides the complete weather record for the incident period. This can help document either that conditions were within acceptable parameters and no protocol breach occurred — or that proper protocols were followed in response to conditions that did exceed thresholds.
Immutable records and access audit logs — the two data integrity requirements For weather data to serve as defensible evidence, two properties are essential. First, the historical log must be immutable: cyclonePort’s archived records cannot be silently edited after the fact. Any annotation or correction applied to a logged value is tracked separately, preserving the original measurement alongside any subsequent notation. Second, access must be auditable: cyclonePort’s platform logs who accessed data and when, and tracks any metadata edits — creating the chain of custody documentation that compliance audits and legal discovery require. Together, immutability and access audit logs establish that the record presented as evidence is the record as originally captured. |
The liability risk of no weather record In the absence of site-specific weather data from the time and location of an incident, adverse parties — plaintiffs’ attorneys, insurance adjusters, OSHA investigators — will use regional weather data from the nearest airport or NWS station to characterize conditions. That data may be miles away, may not reflect local microclimate effects, and may represent conditions meaningfully different from those at your facility. The inability to produce site-specific weather records creates a gap that is exploitable in litigation and adverse in regulatory proceedings. This is the single most underappreciated value of continuous on-site data logging. |
06 Compliance and Regulatory Documentation
cyclonePort data logging supports compliance documentation for a range of regulatory frameworks and organizational policies. The key is that the data logging is automated and continuous — eliminating the manual burden while simultaneously producing records of higher quality and consistency than manual alternatives.
Athletic Safety Compliance
State athletic associations across the United States require that schools monitor and document weather conditions during outdoor practices and events. Requirements vary by state but typically include:
- Designated monitoring responsibility: A named individual must monitor weather conditions before and during all outdoor activities. cyclonePort automates the monitoring function while maintaining the human decision-making layer.
- WBGT recording at defined intervals: A growing number of states require WBGT measurement and recording at 15–30 minute intervals during outdoor athletic activities. cyclonePort’s automated WBGT logging meets this requirement without requiring staff to manually read and record a handheld device every 15 minutes — a task that is frequently missed during busy practice schedules.
- Documentation of activity modifications: When conditions exceeded a threshold, records must show that protocols were followed — practice was modified, shortened, or cancelled. The cyclonePort alert log documents when threshold alerts were sent, to whom, and at what WBGT or heat index value, creating the paper trail that shows protocols were implemented.
- Lightning delay documentation: The 30-minute rule (suspend outdoor activity when lightning is within 10 miles; do not resume until 30 minutes after the last strike within 10 miles) requires accurate logging of both the initial strike detection time and the all-clear time. cyclonePort logs both automatically, with second-level precision, for every lightning event.
OSHA Heat and Weather Safety
OSHA’s proposed federal heat safety standard — and existing OSHA general duty clause enforcement in outdoor work environments — require employers to monitor and document heat conditions at outdoor worksites. The heat index trigger thresholds (≥80°F initial trigger, ≥90°F high-heat trigger) require both real-time response (providing water, shade, rest breaks, buddy system) and a documented record that conditions were monitored at the worksite where exposure occurred.
A cyclonePort data log from a construction site, outdoor event venue, or agricultural operation provides access to this documentation: a continuous record of heat index at the worksite and evidence that monitoring was conducted at the location of exposure — not at a distant official weather station that may not represent on-site conditions.
Insurance Documentation
Property and casualty insurance policies cover specific weather events. A claim denial or underpayment can often follow from the insurer’s inability to verify that the covered event actually occurred at the insured property at the time of the claimed damage — because the claimant has no site-specific weather record. The nearest airport ASOS data may show wind speeds below the policy’s deductible threshold while actual conditions at the property during a microburst or derecho were far higher.
cyclonePort data logging creates the site-specific weather record that closes this evidentiary gap. For properties that have experienced weather-related damage and filed a claim, the cyclonePort archive can help provide a record of measured conditions from the insured location — not an interpolation from miles away.
07 Forensic Weather Reconstruction — Data Logging for Legal and Insurance Use
Forensic weather reconstruction is the discipline of determining precisely what atmospheric conditions were at a specific location at a specific time — for use as evidence in litigation, regulatory proceedings, or insurance claims. The quality of the reconstruction depends on the quality and proximity of the available weather data. On-site cyclonePort logs are measured at the exact location and at the exact time.
What On-Site Data Resolves That Regional Data Cannot
Regional weather data — from the nearest NWS ASOS station, which may be miles from the incident location — is the standard reference used when no better data exists. But it has documented limitations in incident reconstruction:
- Distance bias: Temperature at an urban construction site surrounded by asphalt can be 8–10°F higher than the nearest airport station due to urban heat island effects. A worker heat illness incident that occurred at a heat index of 105°F may be characterized as occurring at a lower value using the airport data.
- Temporal resolution: ASOS stations report hourly under normal conditions. A one-minute peak gust that toppled a scaffold, or the exact moment lightning was within 10 miles when a game delay should have been called, may not appear in hourly ASOS records. cyclonePort logs every event.
- Geographic specificity: A storm cell that produced hail at one location may have produced only heavy rain 2 miles away. The nearest airport data cannot document the hail; the cyclonePort station at the property can.
The forensic standard for weather evidence in legal proceedings Courts and forensic meteorologists treat site-specific, contemporaneous instrumental records as the highest-quality weather evidence available. An on-site data logger that was operational during the incident produces the closest possible approximation to direct measurement — not interpolation, not reconstruction from a distant station, not modeled output. cyclonePort’s continuous archive, with GPS-referenced timestamps and calibrated sensor data, meets this evidentiary standard in a way that post-hoc reconstruction from regional sources cannot. |
Key Reconstruction Applications
- Workplace accident reconstruction: A crane toppled in high winds. What was the actual gust speed at the crane at the time of the accident? Was it within or above the manufacturer’s published shutdown threshold? The cyclonePort archive provides the gust-by-gust record for the incident period, with second-level precision, from the exact worksite location.
- Heat illness litigation: An athlete collapsed during practice. What was the WBGT at the field at that time? Was the value within the category that required modification, and was practice modified? The cyclonePort WBGT log establishes environmental conditions at the time of the incident.
- Property damage claims: A roof was damaged during a storm. What were the maximum wind gusts at the property? The cyclonePort archive documents the peak gust speed, the direction it came from, and the duration of high-wind conditions — providing the event verification that supports or refutes the claim.
- Lightning incident investigation: A person was struck by lightning at an outdoor event. When was the first lightning detection within 10 miles? When was the event suspension protocol triggered? When was the all-clear reached? The cyclonePort archive logs lightning data with timestamps from the station.
- Contract weather delay disputes: A construction project claims force majeure due to weather. The cyclonePort archive at the jobsite documents the exact days and hours when wind speeds, precipitation, or temperature exceeded contractual thresholds — or demonstrates they did not, as the case may be.
08 API and Integration — Connecting Weather Data to Your Systems
cyclonePort weather data is not locked inside the RadarOmega dashboard. A REST API provides programmatic access to both real-time sensor readings and historical archive records, enabling weather data to be integrated into any third-party system, workflow, or analytics platform.
REST API Capabilities
- Real-time endpoint: Pull the current reading for any station at any time — temperature, humidity, heat index, wind, pressure, rainfall, lightning proximity, WBGT, and all derived metrics. Returns JSON with full sensor readings and metadata.
- Historical query endpoint: Retrieve archived data for any station over any time range, at any time resolution from 1-second to daily summary. Returns ordered JSON or CSV with timestamps and all logged parameters.
- Alert/event endpoint: Query the alert history for any station — when thresholds were triggered, what the sensor reading was at trigger time, which recipients were notified.
- Multi-station query: Retrieve current or historical data for all stations in an organization’s network in a single API call, returning a structured dataset suitable for cross-site analysis and comparison.
Integration Use Cases
| Integration Type | What the API Enables |
|---|---|
| Safety management platforms | Push cyclonePort heat index and WBGT data to OSHA recordkeeping, incident management, or workplace safety platforms for automatic documentation of environmental conditions associated with any recorded injury or near-miss. |
| SCADA and industrial control systems | Feed wind speed, temperature, and lightning proximity data into facility control systems for automated protective actions — pausing outdoor conveyor operations when wind exceeds limits, triggering emergency notifications when lightning proximity reaches threshold. |
| Athletic management software | Integrate WBGT and heat index data with practice scheduling platforms, automatically flagging scheduled outdoor activities when forecasted or current conditions are expected to require modification or cancellation. |
| Business intelligence and reporting | Pull historical weather data into Power BI, Tableau, or other BI platforms for correlation analysis — identifying patterns between weather conditions and operational metrics, equipment performance, energy consumption, or incident rates. |
| Agriculture and irrigation control | Feed temperature, humidity, solar radiation, and evapotranspiration data into precision irrigation controllers for automated water management based on actual on-site conditions. |
| Emergency mass notification | Trigger external mass notification systems (public address, digital signage, text broadcast) directly from cyclonePort alert events. |
09 Data Export — CSV, JSON, and Scheduled Reports
All cyclonePort historical data is exportable in standardized formats for use in external analysis tools, regulatory submissions, legal discovery, insurance documentation, and business intelligence applications.
Export Formats
- CSV (Comma-Separated Values): The universal format for weather data analysis. Every logged parameter is exported as a column, every observation as a row, with timestamps in both UTC and local timezone. CSV exports from cyclonePort import directly into Microsoft Excel, Google Sheets, R, Python/pandas, and every major business intelligence platform.
- JSON: Structured data format for API-connected workflows and software integration. Full metadata included: station ID, GPS coordinates, elevation, sensor calibration status, and quality control flags alongside sensor readings.
- Scheduled email reports: Configurable automated reports delivered to defined recipient lists on any schedule. Formats include daily weather summaries, weekly compliance reports, post-event condition summaries triggered by threshold alerts, and custom report templates for specific regulatory formats.
What You Can Export
| Export Type | Use Case |
|---|---|
| Full archive export | Every sensor reading from every parameter for any specified time period. |
| Interval summary export | Summary statistics (maximum, minimum, mean) for each parameter at a specified interval — 15-minute, hourly, daily. |
| Alert history export | Complete log of every alert triggered, with threshold values, sensor readings at trigger time, timestamps, and recipient lists. |
| Event report export | Single-event weather report for a specified date and time range. |
| Derived metrics export | Heat index history, WBGT history, wind chill history, and pressure trend history as standalone exports. |
| Peak extremes export | Maximum gust, maximum temperature, maximum heat index, maximum rainfall rate, minimum temperature, minimum wind chill — with exact timestamps — for any specified period. |
What a query looks like in practice The cyclonePort REST API and export interface are built for operational teams, not just developers. A concrete example: a project manager needs to support a weather delay claim on a construction contract. She queries the cyclonePort archive for all 5-minute wind speed records from the jobsite station between March 1 and March 31, 2026, filtered to readings where sustained wind exceeded 20 mph — then exports to CSV. The resulting file contains every qualifying observation: date, time, wind speed, gust, wind direction, and sensor health status, ready to attach to the delay claim. The same query takes seconds through the dashboard interface or a single API call. |
10 Who Uses cyclonePort Data Logging
Athletic Directors and Certified Athletic Trainers
The data log is what converts weather monitoring from a daily manual task to an automated program. Without continuous automated logging, WBGT compliance requires a staff member to read a device every 15 minutes during every outdoor practice — every day of the fall season. With cyclonePort, the log generates itself.
The athletic trainer receives alerts when thresholds are crossed, documents the delay or modification in the associated incident record, and exports the WBGT history for any compliance audit without manually reconstructing records from handwritten notes.
The archive also serves as institutional memory: what were conditions during the incident that resulted in a heat illness? When did lightning first approach to within 10 miles during the game that was delayed? These questions are answerable from the cyclonePort archive rather than requiring staff to reconstruct events from memory or incomplete manual logs.
Risk Managers and General Counsel
Every weather-related incident involving injury, property damage, or regulatory investigation generates a demand for site-specific weather documentation. Risk managers at schools, universities, municipalities, construction firms, and event venues who have cyclonePort stations can respond to these demands immediately: the data is in the archive. Risk managers without on-site logging face a much harder path — attempting to reconstruct conditions from distant weather stations that did not measure conditions at the specific location and time of the incident.
Proactive deployment of cyclonePort data logging can be a risk management investment that pays dividends when claims occur. The cost of on-site weather data logging is a fraction of the cost difference between a well-documented claim and an undocumented one.
Construction Safety Officers and OSHA Compliance Teams
OSHA’s proposed heat safety standard, its general duty clause enforcement on construction sites, and its crane safety regulations all create documentation requirements that on-site weather data logging can directly satisfy. A safety officer who can produce a continuous heat index record from the jobsite may demonstrate a robust heat safety program. A safety officer who cannot produce site-specific records is relying on regional weather data that may not represent actual jobsite conditions — a gap that OSHA citations and plaintiff litigation can exploit.
Emergency Management Agencies
County and municipal emergency managers can use cyclonePort data logs for after-action review following weather events: what was the time sequence of conditions during the storm? When did wind speeds first exceed road closure thresholds? What was the rainfall rate during the flood event? These questions require the kind of granular, site-specific resolution that the cyclonePort archive provides and regional data cannot.
The archive also supports two specific documentation workflows that arise after major weather events. For insurance claims, municipalities need site-specific records proving that a covered event — wind above a threshold, rainfall above a threshold, etc. — actually occurred at the insured property. For FEMA disaster documentation, counties requesting disaster declarations and reimbursements must demonstrate that conditions at specific locations met eligibility criteria. cyclonePort’s timestamped archive can provide the site-specific evidence both processes require.
For multi-station networks across a county or municipality, the combined archive can provide a spatial picture of weather event progression — which station recorded the first lightning strike, how wind direction shifted as the storm passed, which locations received the most intense rainfall — that supports both post-event analysis and future emergency planning.
Broadcast Meteorologists and Research Programs
Television meteorologists and university weather programs can use cyclonePort data logs to supplement the observational network with hyperlocal observations from facilities where official stations do not exist. A broadcast meteorologist who has access to cyclonePort data from a stadium, a school, or an industrial facility during a severe weather event gains ground-truth observations that improve the accuracy of on-air coverage and post-event analysis. Universities and research programs can use cyclonePort archives for microclimate characterization, urban heat island studies, and local climate trend analysis.
11 System Specifications — Data Logging and Weather Data Services
| Parameter | Specification |
|---|---|
| Logging Rate | Every second for all sensors; configurable averaging intervals (1, 2, 5, 10, 60 minutes) for summary records |
| Timestamp Precision | UTC to the second; local timezone conversion; GPS-referenced station coordinates and elevation |
| Local Buffer | On-device buffering when connectivity is interrupted; automatic sync when connection is restored; no data gaps in archive |
| Cloud Transmission | HTTPS encrypted; cellular (4G LTE), WiFi, or Ethernet; redundant cloud hosting |
| Archive Retention | Full historical archive for the station lifetime; no automatic deletion or rollover. |
| Logged Parameters | Temperature, humidity, dew point, heat index (with NWS category), wind speed (sustained + gust), wind direction, wind chill, barometric pressure, pressure trend, rainfall (rate + cumulative), lightning (strike time + distance), WBGT (where installed), solar radiation/UV (where installed), sensor health flags |
| Data Export | CSV and JSON; selectable time range and resolution; full archive or interval summary; alert history; peak extremes |
| Scheduled Reports | Configurable automated email reports: daily summary, weekly compliance, event-triggered post-event reports; custom templates |
| REST API | Real-time readings endpoint; historical query endpoint; alert/event log endpoint; multi-station batch endpoint; JSON response with full metadata |
| SCADA Integration | Supported via API; Modbus protocol support available |
| Dashboard | RadarOmega web and mobile (iOS, Android, Windows, Mac, Linux); real-time display with sparkline trends; historical chart viewer with multi-parameter overlay; threshold visualization |
| Alert Engine | Configurable thresholds for all logged parameters; SMS, email, push notification delivery; alert log with timestamps; integration with external notification systems via API |
| Data Quality | Automated quality control flags; step-change detection; range validation; calibration-status tracking |
| NIST Traceability | Factory calibration traceable to NIST standards; annual stability within ±0.05°C for temperature sensors |
| Multi-Station | Unlimited stations per account; centralized archive management; cross-station comparison and export |
| Station Lifespan | 10+ years with standard maintenance; data archive persists for station lifetime |
| Data Ownership | Customer owns all logged data. Full export and off-boarding options available. Data does not belong to cyclonePort. |
| Immutability | Historical log records cannot be silently edited. Any correction or annotation is tracked separately with timestamp and user attribution, preserving the original measurement. |
| Access Audit Log | Platform logs all data access and metadata edits by user, with timestamps. Supports chain-of-custody documentation for legal discovery and compliance audits. |
| Remote Power | Optional solar and battery backup kits for off-grid deployments without grid access — agricultural fields, remote construction sites, rural emergency management networks. |
| Commissioning | 7–14 day burn-in and QA validation period following installation; baseline comparison against nearby reference data to verify sensor accuracy before entering the permanent archive. |
Contact cyclonePort for current engineering documentation and deployment options.
Deploy Continuous Weather Data Logging at Your Facility cyclonePort weather surveillance stations include full-featured data logging, cloud archiving, and weather data services as a standard platform capability. Contact our team to configure sensor suite, logging intervals, export formats, and integration requirements for your application. info@cycloneport.com · 844-737-9328 · cycloneport.com/contact |
12 Frequently Asked Questions
What is a weather station data logger?
A weather station data logger is the component that captures, timestamps, stores, and transmits sensor readings automatically and continuously — turning a weather station from a device that shows current conditions into a system that builds a permanent record of atmospheric conditions over time. In traditional deployments, data loggers were separate hardware with onboard memory requiring periodic download. Modern cloud-connected stations like cyclonePort integrate data logging into the station’s onboard processor, transmitting every reading in real time to a secure cloud archive accessible from any device and exportable in CSV, JSON, or API formats.
How often does cyclonePort log weather data?
cyclonePort logs all sensor readings every second. The archive stores second-by-second observations.
Summary intervals (2-minute, 5-minute, 10-minute, hourly, daily) are computed from the second-level data and available for display and export without replacing the underlying high-resolution archive. For compliance reporting that requires readings at specific intervals (e.g., WBGT every 15 minutes per athletic association policy), cyclonePort can generate interval summary exports from the continuous archive.
What happens to logged data if the station loses internet connectivity?
How long is weather data retained in the cyclonePort archive?
The full historical archive is retained for the lifetime of the station deployment with no automatic deletion or rollover. An organization that deploys a cyclonePort station today will have access to every second of data that station has ever collected, for as long as the station remains active. This indefinite retention is designed for the long-tail compliance and forensic use cases where events from months or years prior require accurate weather documentation.
Can cyclonePort weather data be used for OSHA compliance documentation?
What formats can cyclonePort weather data be exported in?
cyclonePort historical data exports in CSV and JSON formats, accessible through the RadarOmega web interface and REST API. CSV exports import directly into Microsoft Excel, Google Sheets, R, Python, Power BI, and other analysis tools. JSON is available for API-connected workflows and software integrations. Exports can cover any time range, at any resolution from second-by-second to daily summary, and can include all logged parameters or specific subsets. Scheduled automated reports in email format are also available for daily summaries, weekly compliance reports, and event-triggered post-event summaries.
Can cyclonePort weather data be used as evidence in legal proceedings?
Site-specific weather data from an on-site instrument that was operational at the time and location of an incident is the highest-quality weather evidence available for legal proceedings — superior to reconstructed data from distant regional stations. cyclonePort archives provide GPS-referenced, timestamped, calibrated sensor data from the exact facility location. This meets the evidentiary standard that forensic meteorologists and courts recognize for contemporaneous instrumental weather records. cyclonePort data is not a substitute for expert forensic meteorological testimony, but it provides the underlying data record that forensic analysis requires.
Does cyclonePort offer a weather data API for integration with other systems?
Who owns my weather data, and what happens if I need to leave the platform?
You own your data. cyclonePort does not claim ownership of sensor readings collected by your station. The full historical archive is yours to export at any time in CSV or JSON format, with no limitations on export volume or time range. If your organization needs to migrate to a different platform or archive storage, cyclonePort provides off-boarding export support to ensure you retain your complete data record. Access controls and audit logs are also exportable, supporting handover documentation requirements for regulated industries.
Related Instruments & Guides
Wind direction is one component of the complete cyclonePort weather station. Explore related instrument pages:
↗ Wind Meter & Anemometer — Wind speed, gust measurement, and Beaufort/Saffir-Simpson context
↗ Barometric Pressure Sensor — Pressure trend analysis for front detection alongside directional wind data
↗ Lightning Detection System — Lightning detection integrated with wind direction for complete storm awareness
↗ WBGT Monitor & Heat Stress Sensor — Heat stress monitoring with wind direction context for heat index and comfort
↗ Temperature Sensor — Air temperature monitoring alongside wind chill and heat index calculation
↗ Humidity Sensor & Hygrometer — Relative humidity and dew point with wind direction for air mass characterization
↗ Rain Gauge — Precipitation monitoring alongside wind direction for storm tracking and front passage documentation
Related Instruments & Guides
cyclonePort data logging captures all parameters from every instrument in the station. Explore individual sensor pages for technical depth on each component of the data record:
↗ Live Weather Monitoring Station — Complete platform overview: sensors, live streaming camera, radar integration, and real-time operations [link]
↗ Temperature Sensor & Heat Index — Dry bulb temperature, heat index calculation, and NWS danger thresholds logged continuously [link]
↗ WBGT Monitor & Heat Stress Sensor — Wet bulb globe temperature logging for athletic association compliance [link]
↗ Lightning Detection System — Strike proximity logging and 30/30 rule alert documentation [link]
↗ Wind Meter & Anemometer — Wind speed and gust logging for crane safety, OSHA compliance, and storm documentation [link]
↗ Wind Vane & Wind Direction Sensor — Directional data logging for fire weather, smoke plume tracking, and frontal passage documentation [link]
↗ Barometric Pressure Sensor — Pressure trend logging as the earliest storm approach signal in the data record [link]
↗ Rain Gauge — Precipitation accumulation and rate logging for flood documentation and insurance claims [link]
↗ Humidity Sensor & Hygrometer — Relative humidity and dew point logging for heat index and comfort analysis [link]






Built for Severe Weather
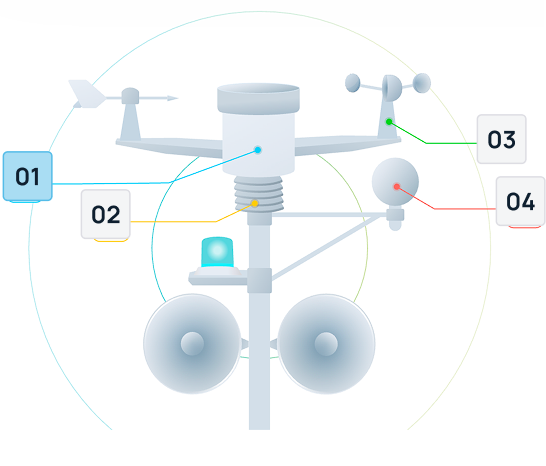
Remote system management from anywhere
Deploy high-quality PTZ (Pan-Tilt-Zoom) IP cameras designed for effortless setup and immediate operation through plug-and-play simplicity. This advanced design significantly reduces installation time and complexity, making sophisticated surveillance accessible for businesses of all sizes. Multiple cameras connect seamlessly to the network.
Remote system management from anywhere
Deploy high-quality PTZ (Pan-Tilt-Zoom) IP cameras designed for effortless setup and immediate operation through plug-and-play simplicity. This advanced design significantly reduces installation time and complexity, making sophisticated surveillance accessible for businesses of all sizes. Multiple cameras connect seamlessly to the network.
Remote system management from anywhere
Deploy high-quality PTZ (Pan-Tilt-Zoom) IP cameras designed for effortless setup and immediate operation through plug-and-play simplicity. This advanced design significantly reduces installation time and complexity, making sophisticated surveillance accessible for businesses of all sizes. Multiple cameras connect seamlessly to the network.
Remote system management from anywhere
Deploy high-quality PTZ (Pan-Tilt-Zoom) IP cameras designed for effortless setup and immediate operation through plug-and-play simplicity. This advanced design significantly reduces installation time and complexity, making sophisticated surveillance accessible for businesses of all sizes. Multiple cameras connect seamlessly to the network.
Learn From The Field

- Guides
Cal/OSHA Heat Regulations for Outdoor Workers: What California Employers Must Know
- Guides
GCSAA Lightning Safety Guidance for Golf Courses: A Complete Compliance Guide