Dry Bulb Temperature & Heat Sensor
Professional dry bulb air temperature measurement for weather surveillance networks — a foundational sensor that aids in heat index calculation, wind chill, dew point, storm forecasting, and every derived comfort metric used by emergency management, outdoor safety operations, athletics, construction, and public health programs.
Contents
01 The Instrument — What Dry Bulb Temperature Measures
02 Dry Bulb vs. Wet Bulb vs. Dry Globe — Understanding the Distinctions
03 Dry Globe Temperature — Capturing Radiant Heat Dry Bulb Cannot See
04 How Temperature Sensors Work — RTD and Thermistor Technology
05 The Radiation Shield — Why Housing Matters as Much as the Sensor
06 Heat Index — What It Is, How It Is Calculated, and Its Limits
07 Wind Chill — The Cold-Weather Counterpart
08 Derived Metrics from Dry Bulb Temperature
09 NWS Heat Index Danger Levels — The Operational Threshold Framework
10 Operational Applications
11 Instrument Selection Guide
12 Installation & Maintenance
13 cyclonePort Temperature Monitoring System — Platform, Integration & Deployment
14 Frequently Asked Questions

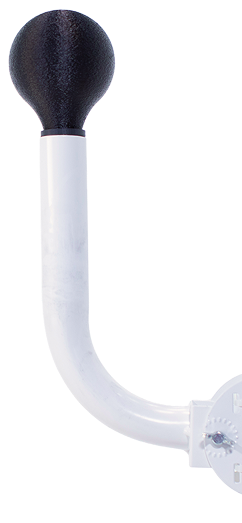

- 0.2°C
Accuracy
- –40°C to +60°C
Range
- Aspirated
01 The Instrument — What Dry Bulb Temperature Measures
Dry bulb temperature — shortened to dry bulb or Tdb — is the standard ambient air temperature measured by a thermometer or electronic sensor shielded from radiation and moisture. It is the temperature reading that appears in every weather forecast, news broadcast, and NWS observation: the actual temperature of the air, measured in the shade, at a defined height above the ground, without the cooling effect of evaporation. In thermodynamic terms, dry bulb temperature measures sensible heat — the energy content of air that changes its temperature without altering its moisture content, as distinct from latent heat, which is the energy bound up in water vapor.
In a cyclonePort weather monitoring system, the term ‘dry bulb’ originates from the classical psychrometer — a paired-thermometer instrument in which one sensor (the dry bulb) measures air temperature directly while the other (the wet bulb) has a moistened wick that cools by evaporation. The relationship between the two readings (typically along with atmospheric pressure) is used to determine humidity variables such as relative humidity and dewpoint. In modern electronic weather stations, the ‘dry bulb’ is simply the ambient air temperature sensor — the thermistor or RTD housed inside the station’s radiation shield — distinguished from the wet bulb by its dry, unmodified measurement.
Dry bulb temperature is a foundational input to many derived weather metrics Heat index, wind chill, dewpoint, relative humidity, apparent temperature, WBGT, vapor pressure, evapotranspiration — every one of these operationally important variables depend directly or indirectly on dry bulb temperature. Accurate dry bulb measurement is therefore not just one sensor among many; it is the anchor that determines the accuracy of nearly every composite metric the station calculates. |
In a cyclonePort weather surveillance station, the temperature sensor is housed inside a radiation shield that prevents direct solar heating of the sensor while maintaining airflow — the same principle that defines all WMO-standard meteorological temperature measurements. The sensor delivers ±0.2°C accuracy continuously, with data flowing through RadarOmega alongside wind, humidity, pressure, rain, lightning, and camera feeds.
02 Dry Bulb vs. Wet Bulb — Understanding the Distinction
The dry bulb / wet bulb distinction is foundational to understanding how meteorologists characterize heat stress — and why no single temperature reading fully describes how hot or cold a person actually feels.
| Temperature Metric | What It Measures and When It Applies |
|---|---|
| Dry Bulb Temperature (Tdb) | The actual ambient air temperature measured by a thermometer shielded from radiation and moisture. The temperature value you see in a weather forecast. Does not account for humidity, evaporation, solar radiation, or wind. |
| Wet Bulb Temperature (Twb) | The lowest temperature achievable through evaporative cooling under current atmospheric conditions. Measured by a thermometer covered in a moistened wick. The difference between dry bulb and wet bulb — called the wet bulb depression — indicates how much moisture the air can absorb: a large depression means dry air with strong evaporative cooling potential; a depression near zero means air is nearly saturated and sweating becomes ineffective. At 100% relative humidity, wet bulb equals dry bulb — no further evaporative cooling is possible. |
| Globe Temperature (Tg) | Air temperature measured inside a matte black sphere (typically 150mm diameter) that absorbs solar radiation and infrared energy from surrounding surfaces — without any water or wick. Globe temperature reflects the combined effects of radiant heat, ambient air temperature, and air movement, making it useful for assessing heat stress and radiant heat load. The difference between globe temperature and dry bulb temperature reveals how much additional thermal load the sun and hot surfaces add beyond ambient air temperature. A dry bulb temperature of 30°C alongside a globe temperature of 38°C signals an 8°C radiant heat differential that dry bulb temperature alone would miss entirely. Artificial turf surfaces can reach 60–70°C on hot days, radiating substantial heat toward anyone in the area — conditions the globe temperature captures and dry bulb temperature cannot. |
| Wet Bulb Globe Temperature (WBGT) | A composite heat stress index for outdoor environments combining dry bulb temperature (10%), wet bulb temperature (70%), and globe temperature (20%). A widely accepted standard used in occupational heat-stress assessment and referenced in workplace heat-safety guidance. Requires a physical black globe sensor in addition to dry bulb and wet bulb temperature measurements. |
| Heat Index | A calculated ‘feels like’ temperature derived from dry bulb temperature and relative humidity for shade conditions. Most applicable at temperatures ≥ 80°F and relative humidity ≥ 40%. Does not account for direct sunlight, wind, or physical exertion. Less representative of total heat stress for active outdoor populations than WBGT. |
| Dewpoint | The temperature at which air becomes saturated and water vapor begins to condense. Often calculated from dry bulb temperature and relative humidity. A strong indicator of atmospheric moisture and a useful proxy for human-perceived mugginess. As a rule of thumb, a dewpoint above 65°F (18°C) is considered muggy; above 70°F (21°C) feels oppressive and can contribute to elevated heat-stress risk, especially in hot conditions. |
The most important operational distinction Dry bulb temperature tells you what the air temperature is. Wet bulb temperature indicates how much evaporative cooling the environment allows. For example, how effectively the human body can cool itself by sweating. At the same dry bulb temperature, a humid day is far more dangerous than a dry day because the wet bulb temperature is higher — meaning sweat evaporates more slowly and the body’s primary cooling mechanism is less effective. This is why dry-bulb temperature alone is often insufficient for outdoor safety decisions, and why metrics such as heat index, dewpoint, and especially WBGT are used to better assess heat risk for outdoor workers and athletes. |
03 Dry Globe Temperature — Capturing Radiant Heat Dry Bulb Cannot See
Dry bulb temperature measures the shaded air. Globe temperature reveals how much additional heat load is being imposed by the sun and surrounding surfaces. That distinction becomes critical on sunny days, over artificial turf, pavement, rooftops, and other environments where radiant heat can greatly increase real-world heat stress beyond what air temperature alone suggests.
What Dry Globe Temperature Is
Globe temperature (Tg) is measured inside a matte black sphere — typically 150mm in diameter — that absorbs solar and infrared radiation from the surrounding environment, just as human skin and clothing do. The globe serves as a standardized indicator of radiant heat load. Unlike a wet bulb sensor, it uses no water or wick, so its reading is not influenced by evaporative cooling. Globe temperature reflects the combined effects of radiation, ambient air temperature, and air movement, making it useful to compare with dry-bulb temperature when assessing additional heat load from the sun and hot surrounding surfaces.
The difference between globe temperature and dry bulb temperature is the diagnostic signal: it quantifies how much additional thermal load the sun and surrounding hot surfaces are imposing on anyone in that environment. A reading of dry bulb 30°C alongside dry globe 38°C reveals an 8°C radiant heat differential — conditions far more stressful than the air temperature alone suggests.
Why artificial turf makes dry globe essential Artificial turf surface temperatures routinely reach 60–70°C on hot sunny days — 30–40°C above the ambient air temperature. These surfaces radiate substantial infrared energy toward athletes exercising on them, creating a thermal environment dramatically more severe than any shaded thermometer reading can capture. A dry bulb reading of 88°F on the sideline may correspond to globe temperatures equivalent to 100°F+ at field level — a different risk category entirely. The globe temperature sensor, positioned to receive the same solar and surface radiation exposure as the athletes themselves, captures this gap in real time. |
04 How Temperature Sensors Work — RTD and Thermistor Technology
RTD Sensors (Resistance Temperature Detectors)
An RTD is a temperature sensor built from a metal element — almost always platinum — whose electrical resistance increases predictably and nearly linearly with temperature. The most common standard is the Pt100: a platinum element with 100 ohms of resistance at 0°C, increasing by approximately 0.385 ohms per degree Celsius (the alpha coefficient specified by IEC 60751).
Platinum is used because it is chemically stable, has a highly linear resistance-temperature relationship across a wide range (roughly –200°C to +850°C, depending on sensor construction), and exhibits minimal drift over years of continuous operation. RTDs achieve accuracy of ±0.1°C to ±0.3°C in typical meteorological ranges and are widely used in research-grade and professional meteorological instrumentation.
RTD accuracy classes — IEC 60751 Class A RTDs have a maximum allowable error of ±0.15°C at 0°C, tightening to ±0.25°C at 100°C. Class B RTDs allow ±0.30°C at 0°C. 1/3 DIN (a tighter tolerance subclass) achieves ±0.10°C at 0°C. For professional outdoor weather stations where heat index and WBGT calculations depend on temperature accuracy, Class A or 1/3 DIN RTDs are the appropriate specification. cyclonePort stations use high-accuracy RTD elements that achieve ±0.2°C across the full outdoor operating range. |
Thermistors
A thermistor is a semiconductor device (typically a ceramic metal-oxide composite) whose electrical resistance changes dramatically with temperature — far more so than a platinum RTD. This high sensitivity makes thermistors excellent for detecting small temperature changes but introduces a challenge: the resistance-temperature relationship is highly non-linear, and is typically modeled with equations such as the Steinhart–Hart equation rather than the near-linear approximation often used for RTDs over limited ranges.
High-quality glass-encapsulated thermistors achieve ±0.1–0.2°C accuracy and can maintain this stability over years — comparable to RTDs — with proper calibration. However, cheaper thermistors degrade more rapidly, exhibit more temperature hysteresis, and have a narrower linear range. For professional weather station applications requiring reliable long-term accuracy, platinum RTDs are generally preferred; thermistors are common in consumer-grade weather instruments where cost is the primary constraint.
Signal Conditioning and Temperature Compensation
Raw sensor resistance output requires conversion to temperature using calibration curves (IEC 60751 for RTDs, Steinhart-Hart for thermistors) implemented in the station’s onboard electronics. Professional stations include temperature compensation for the electronics themselves — ensuring that changes in the circuit board temperature due to ambient conditions don’t introduce measurement errors into the sensor reading. cyclonePort’s temperature measurement system includes onboard signal conditioning, factory calibration coefficients stored in non-volatile memory, and firmware-level thermal compensation across the full operating range.
| Calibration and automated quality control |
| NIST-traceable calibration: Every cyclonePort station ships with factory calibration traceable to NIST (National Institute of Standards and Technology) standards, providing the documented calibration chain required for regulatory compliance and legal defensibility. |
| Long-term stability: Properly maintained platinum RTD sensors typically remain within ±0.05°C of their factory calibration value over an annual calibration cycle — far tighter than the ±0.2°C stated accuracy specification, which includes all error sources across the full operating range. |
| Automated step-change detection: RadarOmega flags implausible readings in real time — a step change exceeding 2°C per minute (indicating a sensor failure, wiring fault, or physical disturbance rather than a genuine atmospheric event) triggers an automated alert and prompts investigation before corrupted data enters safety decision workflows. |
| Range validation: Readings outside the physically plausible range for the deployment location and season are flagged for review. Combined with manual field verification using calibrated reference instruments, this ensures long-term measurement integrity. |
04 The Radiation Shield — Why Housing Matters as Much as the Sensor
The most accurate temperature sensor in the world will produce meaningless data if it is installed in inadequate housing. This is the most frequently overlooked aspect of outdoor temperature measurement — and the most common source of systematic error in field deployments.
The fundamental problem: any temperature sensor installed outdoors will absorb solar radiation, which heats the sensor above the true air temperature. The error depends on solar angle, cloud cover, wind speed, and the thermal characteristics of the housing — but it is always positive (too warm), and it is frequently large. Research has documented solar radiation errors of up to 1.8°C in passively ventilated shields under low-wind, high-radiation conditions. Without wind to ventilate the housing, the trapped air inside heats up rather than representing the ambient air outside.
Solar radiation error — the hidden accuracy killer A temperature sensor in a cheap multi-plate passive shield can read 1–2°C too warm on sunny, calm days — conditions that frequently coincide with the hottest periods of the day, when accurate temperature data is most critical for heat safety decisions. At 90°F air temperature, a 2°C error is a 3.6°F error — enough to shift a heat index calculation by 5–8°F and potentially place conditions in a different safety threshold category. The shield is not a secondary specification: it is as important as the sensor itself. |
Types of Radiation Shields
| Shield Type | Performance Characteristics |
|---|---|
| Passive multi-plate shield (standard) | Multiple horizontally stacked plastic plates create a shaded cavity around the sensor. Relies on natural wind ventilation to exchange trapped air with ambient air. Adequate at wind speeds above 2–3 m/s; introduces significant radiation error at low wind speeds on sunny days. Error can reach 1°C or more under extreme conditions. |
| Fan-aspirated (motorized) shield | A small fan continuously draws ambient air across the sensor at a controlled rate, eliminating dependence on natural wind. Dramatically reduces solar radiation error — typically less than 0.2°C even at 1000 W/m² solar irradiance. The gold standard for research and reference-quality temperature measurements. Limitation: fan motor requires power; mechanical reliability must be maintained. |
| Helical (passive natural ventilation) | A patented spiral or helical design that creates internal air circulation through aerodynamic geometry rather than a fan. Some designs (e.g., BARANI MeteoShield Professional) match or exceed fan-aspirated shield accuracy without moving parts, according to WMO intercomparison testing. Lower maintenance than fan-aspirated designs. |
| Stevenson screen (traditional enclosure) | A louvered wooden or plastic box historically used as the meteorological standard for temperature measurement. Still used at many established observation sites for continuity with historical records. Larger footprint than modern shields; slower response time; less suitable for automated weather stations. |
cyclonePort temperature sensors are housed in a radiation-shielded enclosure designed for continuous outdoor deployment. The shield design achieves ±0.2°C accuracy across the full operating temperature range through a combination of thermal mass management, passive ventilation geometry optimized for typical wind conditions at facility sites, and white UV-stable construction that minimizes solar absorption.
05 Heat Index — What It Is, How It Is Calculated, and Its Limits
The heat index — also called apparent temperature or the ‘feels like’ temperature — is a calculated value that expresses how hot the air feels to a person based on the combined effect of dry bulb temperature and relative humidity. The scientific foundation of the heat index was developed by Robert Steadman in 1979 and has been the primary NWS heat safety metric for public communication in the United States ever since.
The Physics of Heat Index — Why Humidity Changes the Feel
The human body cools itself primarily through sweating. When sweat evaporates from skin, it carries heat away from the body surface. The effectiveness of this cooling depends strongly on how readily water vapor can move from the skin into the surrounding air, so it decreases as relative humidity rises. In dry air, sweat evaporates rapidly and cooling is more effective. In humid air, especially near saturation, sweat evaporates more slowly, reducing cooling and increasing the risk of overheating during the same level of exertion.
Heat index captures this effect by expressing the temperature that a person in the shade would need to experience in 40% relative humidity to feel the same level of thermal discomfort as they actually feel at the current temperature and humidity. At 90°F and 65% relative humidity, the heat index is approximately 105°F — the air feels 15°F hotter than the thermometer reads because the humidity is suppressing evaporative cooling.
The NWS Heat Index Formula
The NWS heat index is computed using the Rothfusz regression equation, itself derived from Steadman’s original biometeorological tables. The equation is a multivariate polynomial in temperature (T, in °F) and relative humidity (RH, in percent):
| NWS Heat Index Formula (Rothfusz Regression) |
| HI = –42.379 + 2.04901523(T) + 10.14333127(RH) – 0.22475541(T)(RH) – 0.00683783(T²) – 0.05481717(RH²) + 0.00122874(T²)(RH) + 0.00085282(T)(RH²) – 0.00000199(T²)(RH²) |
| Where: T = dry bulb temperature in °F | RH = relative humidity in percent |
| Valid range: T ≥ 80°F and RH ≥ 40%. Below these values, a simpler linear formula is used. |
| Error: The regression approximates Steadman’s original tables to within ±1.3°F. |
| Adjustments: An additive correction is applied when RH < 13% and T is between 80°F–112°F (low-humidity adjustment). A second correction applies when RH > 85% and T is between 80°F–87°F. |
Critical Limitations of the Heat Index
Heat index is useful as a public communication metric, but has important limitations that make it less suitable for safety-critical heat-stress assessment:
- Shade only: The NWS heat index is calculated for shaded areas. According to the NWS, direct sunlight can increase the apparent temperature by up to about 15°F (8°C) beyond the calculated heat index. A person working in full sun on a 90°F day with a calculated heat index of 100°F may experience conditions up to 115°F.
- Light-wind assumption: The heat index formula is based on light-wind conditions. Lower wind speeds produce higher effective heat stress than the heat index predicts; higher wind speeds in humid conditions may make conditions feel less extreme than the heat index indicates.
- No physical exertion factor: Heat index is calculated for a person at rest or in light activity. Workers performing heavy physical labor generate metabolic heat that adds substantially to the environmental heat load — a factor not captured by the heat index.
- WBGT is more accurate for active outdoor populations: For occupational safety and athletic heat stress management, WBGT (Wet Bulb Globe Temperature) — which includes solar radiation (black globe) and more accurately represents the conditions experienced by a physically active person in direct sun — is generally the preferred metric. cyclonePort stations with WBGT provide a more complete heat stress picture.
Despite these limitations, heat index remains the most widely used heat comfort metric in the United States for public communication, consumer weather products, and many workplace safety applications. cyclonePort calculates and displays heat index in real time from every station’s temperature and humidity data in RadarOmega.
06 Wind Chill — The Cold-Weather Counterpart
Wind chill is the cold-weather counterpart to heat index: a calculated apparent temperature that expresses how cold the air feels when wind-driven heat loss from exposed skin is taken into account. While heat index describes how high humidity makes hot conditions feel worse, wind chill describes how wind makes cold conditions feel worse.
When wind blows across exposed skin, it disrupts the thin, insulating layer of warm air that forms against the skin surface and carries the heat away more rapidly. The faster the wind, the faster the heat loss, and the colder the skin temperature drops — even though the actual air temperature is unchanged. The current NWS/Environment Canada wind chill formula was developed jointly in 2001 by U.S. and Canadian scientists and medical experts:
| NWS Wind Chill Formula |
| Wind Chill (°F) = 35.74 + 0.6215T – 35.75(V^0.16) + 0.4275T(V^0.16) |
| Where: T = dry bulb air temperature in °F | V = wind speed in mph |
| Valid range: T ≤ 50°F and V > 3 mph. Below 3 mph, wind chill equals air temperature. |
| Model assumptions: walking into wind at 1.4 m/s, bare face, wind speed corrected to 5-foot height. |
Like heat index, wind chill requires both dry bulb temperature AND a second variable (wind speed) — underscoring why a complete weather surveillance station, not a single sensor, is needed for meaningful apparent temperature calculations. cyclonePort computes and displays wind chill automatically from the station’s temperature and anemometer readings whenever conditions are within the valid range (≤50°F, wind >3 mph).
Wind chill danger thresholds — frostbite risk At wind chill –20°F: exposed skin can freeze in 30 minutes. At –40°F: exposed skin can freeze in 10 minutes. At –60°F: exposed skin can freeze in less than 5 minutes. These frostbite risk windows are the basis for NWS Wind Chill Warnings, which are issued when wind chills reach –20°F to –25°F or lower depending on the region. cyclonePort stations provide automated wind chill alerts to protect outdoor workers, utility crews, first responders, and school personnel when dangerous wind chill thresholds are approached. |
07 Derived Metrics from Dry Bulb Temperature
Dry bulb temperature is the primary input for a family of calculated weather variables. Each serves a distinct operational purpose:
| Derived Metric | What It Calculates and Why It Matters |
|---|---|
| Heat Index | Apparent temperature combining T and relative humidity. NWS public heat safety metric. Valid ≥80°F and ≥40% RH. Assumes shade, light wind, rest. See Section 05. |
| Wind Chill | Apparent temperature combining T and wind speed. Cold-weather skin cooling rate metric. Valid ≤50°F and >3 mph. See Section 06. |
| Dew Point | Temperature at which air becomes saturated and condensation forms. Calculated from T and relative humidity. A proxy for atmospheric moisture and human comfort. Dew point >65°F = muggy; >70°F = oppressive. |
| Relative Humidity | Percentage of maximum possible moisture the air holds at current temperature. Calculated from T and absolute humidity or dew point. Temperature changes relative humidity even when actual moisture content is constant: warming air decreases RH; cooling air increases RH. |
| WBGT (Wet Bulb Globe Temperature) | Composite heat stress index using dry bulb (10%), wet bulb (70%), and black globe temperature (20%). Widely used in occupational and athletic heat safety — requires dedicated wet bulb and globe sensors in addition to dry bulb. See cyclonePort WBGT page. |
| Apparent Temperature (AT) | Australian Bureau of Meteorology composite index combining dry bulb, humidity, and wind speed for a more complete ‘feels like’ metric than the NWS heat index, particularly useful in warm, windy, and humid conditions. |
| Evapotranspiration (ET) | Agricultural water demand index combining T, solar radiation, humidity, and wind. Used for irrigation scheduling. Requires dry bulb temperature alongside other sensor inputs. |
| Degree Days (HDD/CDD) | Cumulative temperature departures from a base value, commonly 65°F, used for energy consumption modeling. Heating degree days (below 65°F) and cooling degree days (above 65°F) are calculated from daily dry bulb maximum and minimum. |
08 NWS Heat Index Danger Levels — The Operational Threshold Framework
The NWS categorizes heat index values into four risk levels that correspond to escalating health impacts with prolonged exposure and physical activity. These categories are widely used in public education and situational awareness, but local warning thresholds and heat-response plans vary by jurisdiction and may use additional criteria beyond heat index alone.
| Heat Index Level | Health Risk & Required Action |
|---|---|
| Caution (HI 80–90°F) | Fatigue possible with prolonged exposure or strenuous activity. For most healthy adults, conditions are manageable with hydration and rest breaks. At-risk populations — elderly, infants, individuals with chronic conditions — may experience symptoms at lower heat index values. Appropriate action: monitor at-risk individuals; ensure water availability. |
| Extreme Caution (HI 91–103°F) | Heat cramps and heat exhaustion possible with prolonged exposure or strenuous activity. Heat stroke is possible with extreme physical exertion. Washington D.C. activates its Heat Emergency Plan at a heat index of 95°F or higher. Appropriate action: limit strenuous outdoor activity; implement mandatory rest breaks; open cooling centers. |
| Danger (HI 103–124°F) | Heat cramps and heat exhaustion likely; heat stroke possible without physical exertion, particularly for at-risk populations. OSHA’s proposed high-heat trigger (heat index ≥90°F) falls within this zone. Appropriate action: avoid outdoor work during peak heat; reschedule to cooler parts of the day; mandatory cooling protocols. |
| Extreme Danger (HI 125°F+) | Heat stroke highly likely for most individuals. Without physical exertion, these conditions are life-threatening. Associated primarily with extreme heat wave events. Appropriate action: halt all outdoor activity; maximum emergency cooling measures; medical monitoring. |
Direct sunlight can add up to 15°F to heat index — a critical safety adjustment The NWS heat index danger levels are calculated for shaded conditions. In direct sunlight, apparent heat stress can be substantially higher; NWS guidance notes that full sunshine can increase the apparent temperature by up to about 15°F (8°C).. A heat index of 95°F in the shade corresponds to an effective apparent temperature of up to 110°F in full sun — shifting the risk classification from Extreme Caution to Danger or beyond. For athletes on exposed turf fields, construction workers on sun-baked concrete, and outdoor event staff, the shaded heat index is consistently an underestimate of actual heat stress conditions. This is one of the key reasons why WBGT — which directly measures solar radiation through the black globe sensor — is generally more appropriate for active outdoor populations. |
09 Operational Applications
Outdoor Athletic Programs — Heat and Cold Safety
Air temperature — along with the heat index and wind chill derived from it — drives the most time-sensitive safety decisions in outdoor athletics. Heat index determines work-rest protocols, cooling requirements, and practice cancellation thresholds for summer programs. Wind chill determines safe exposure limits, equipment requirements, and postponement decisions for winter programs.
The fundamental limitation of relying on a regional weather forecast or phone app for these decisions is geographic specificity: a stadium or athletic field may experience temperatures 5–10°F different from the nearest airport observation station due to surface heating from artificial turf, urban heat island effects, or local topography. A cyclonePort station on the facility measures the actual temperature at that location — not a regional average — updated continuously throughout practice.
- Summer football, soccer, and field sports: Turf surface temperatures routinely exceed air temperature by 30–50°F on sunny days. A cyclonePort air temperature reading of 90°F at the sideline with 70% relative humidity produces a heat index of approximately 105°F in the shade — and potentially 120°F in full sun on the field surface. Used alongside WBGT, these measurements help athletic staff make more informed decisions about practice modification, rest breaks, hydration, and cooling.
- Winter football and outdoor athletics: In cold weather, on-site temperature and wind data allow wind chill to be monitored in real time so athletic staff can respond before conditions become hazardous. Exact cold-weather thresholds vary by sport and governing body, but this data can help athletic directors, trainers, and coaches evaluate whether additional protection, schedule changes, or postponement should be considered.
- Marching band and outdoor performing arts: Marching band, drum corps, and other outdoor performance programs can face many of the same environmental heat risks as athletic teams because they involve prolonged outdoor exposure and sustained exertion. On-site monitoring of temperature, humidity, heat index, and — where available — WBGT supports safer scheduling and environmental awareness for both athletic and performance programs from a single station.
Emergency Management — Heat Wave and Cold Event Response
Heat is consistently among the deadliest weather hazards in the United States. Public health agencies and emergency managers use temperature, heat index, forecast trends, and other local criteria to activate heat emergency plans, open cooling centers, issue public advisories, and coordinate wellness checks for vulnerable populations.
The cyclonePort network provides emergency managers with site-specific temperature readings from across a monitored jurisdiction in real time — not interpolated from a single airport observation station potentially miles away. During a heat wave, temperatures can vary significantly within the same city or county depending on surface cover, vegetation, and proximity to water. Site-specific readings identify where cooling center activation is most urgent and where vulnerable populations face the greatest risk.
For cold events — including winter storms, arctic outbreaks, and dangerous wind chill episodes — the same station network provides the wind chill data that can support decision-making for school closures, outdoor worker safety protocols, and utility crew safety policies for working in extreme cold.
Construction, Industry, and Outdoor Workers
OSHA’s proposed federal heat safety standard — the first federal occupational heat regulation in U.S. history — uses heat index as the primary operational trigger metric for mandatory worker protections:
- Initial heat trigger (heat index ≥80°F): Employers must provide water access, rest opportunities, and shade access.
- High heat trigger (heat index ≥90°F): Mandatory rest breaks every two hours, buddy system, heat illness monitoring, and supervisor observation. All outdoor workers must be provided cool water and shade.
Employers who deploy a cyclonePort station at the worksite gain two simultaneous advantages: the real-time heat index data needed to implement these protocols correctly, and the documented, timestamped temperature and heat index record that demonstrates compliance with OSHA requirements and reduces liability exposure in heat-related incident investigations.
The need for defensible on-site monitoring is growing as regulators, insurers, and employers place greater emphasis on occupational heat risk. Organizations with documented local weather monitoring and formal heat-safety procedures are generally better positioned than those relying only on regional forecast data or informal supervisor judgment.
Accurate temperature data also enables proactive operational planning that reduces heat exposure risk before it reaches critical thresholds:
- Scheduling adjustments: Moving outdoor work or practice to early morning hours — before the peak heat index window of 10 a.m.–4 p.m. — can cut cumulative heat exposure by 50% or more on hot summer days. cyclonePort’s historical temperature data quantifies the actual temperature difference between morning and afternoon at the specific worksite, making the scheduling benefit concrete rather than estimated.
- Shift staggering: Industrial sites can rotate crews in and out of heat-exposed tasks based on cumulative exposure tracked through logged temperature and heat index readings — ensuring no individual accumulates dangerous heat load even when overall site heat index stays below the high-heat trigger threshold.
- Infrastructure investment targeting: Sustained high dry globe vs. dry bulb differentials from cyclonePort stations identify exactly which areas of a facility — specific equipment rows, loading docks, south-facing walls — radiate the most heat. This data directs shade structure, misting system, or surface treatment investments to where they will provide the greatest worker protection benefit per dollar spent.
In cold weather, on-site temperature and wind measurements also support continuous calculation of wind chill, an important screening metric in OSHA cold-stress guidance and other occupational safety programs. cyclonePort stations provide the combined temperature and wind speed data needed to calculate wind chill continuously at the specific worksite.
Agriculture — Evapotranspiration, Irrigation, and Livestock
Air temperature is one of the primary environmental variables used to estimate evapotranspiration (ET) — the combination of water evaporation from soil and transpiration from plants. ET determines crop water demand, irrigation scheduling, and drought stress monitoring. Accurate on-site temperature measurement is critical for ET models because regional temperature data from distant stations misrepresents the microclimate conditions at the field level.
For livestock operations, temperature and heat index monitoring supports heat stress management for animals — particularly dairy cattle, poultry, and swine, which have specific temperature-humidity thresholds for reduced productivity and mortality risk. cyclonePort weather data can support these monitoring and management protocols with continuous local observations.
Utilities, Industrial, and Infrastructure
Temperature drives equipment performance in several operationally critical ways for utilities and industrial operations. Electrical transmission lines experience increased resistance and reduced capacity in high heat, and critical protection systems that depend on thermal calculations require accurate ambient temperature data. Natural gas pipelines have temperature-dependent flow characteristics. Substation equipment has temperature-based loading limits that are directly affected by ambient conditions.
On cold winter days, equipment de-icing, pipeline freeze protection, and substation heating requirements all depend on accurate temperature monitoring. A cyclonePort station at a substation or pipeline segment provides the ambient temperature data that drives these operational decisions from the actual location — not from a distant weather station that may not represent local conditions.
10 Instrument Selection Guide
Temperature sensors for professional weather surveillance span a wide performance range. These are the specifications that determine whether a system provides operationally reliable data or misleading readings that undermine safety decisions.
| Specification | What to Require |
|---|---|
| Sensor Technology | Platinum RTD (Pt100 or equivalent) for professional meteorological accuracy and long-term stability. Thermistors are acceptable if properly calibrated and glass-encapsulated (±0.1–0.2°C class). Avoid cheap bimetallic or consumer-grade thermistor sensors that drift within one to two seasons of outdoor deployment. |
| Accuracy | ±0.2°C is the professional standard for meteorological-quality temperature measurement. ±0.5°C is acceptable for many operational applications. Consumer sensors often specify ±1–2°C — inadequate for heat index calculations where a 1°C temperature error can introduce a 2–3°F heat index error. |
| Radiation Shield Quality | The most underspecified aspect of temperature sensor selection. Require documentation of the solar radiation error at low wind speed and high solar irradiance. A sensor accurate to ±0.2°C in a poor shield may measure 1–2°C too warm in full sun. Passive shields should specify error at 1000 W/m² solar irradiance and 0.5 m/s wind speed. |
| Aspirated vs. Passive Shield | Fan-aspirated shields provide the lowest solar radiation error (<0.2°C) at the cost of fan maintenance and power draw. High-quality passive or helical shields are adequate for most professional applications and have no moving parts. Specify which design is used and request published intercomparison data. |
| Response Time | Fast response (time constant <30 seconds) is needed for monitoring rapidly changing conditions such as cold fronts and pop-up convective storms. Slower sensors miss temperature changes between sampling intervals. |
| Operating Range | The sensor and shield must perform across the full range of conditions at the deployment site. For most U.S. locations, –40°C to +60°C is appropriate. Verify the shield’s radiation error specification across this range. |
| Derived Metric Output | Verify the platform computes heat index, wind chill, dew point, and apparent temperature automatically — not just raw temperature. These derived metrics are what operations teams actually use for decision-making, and they require the platform to correctly implement the NWS formula with appropriate range checks and adjustments. |
| Integration | Temperature data is most valuable in context: alongside humidity (for heat index and dew point), wind speed (for wind chill), solar radiation (for WBGT), and lightning/pressure (for storm monitoring). Standalone temperature sensors without multi-sensor integration provide limited operational value. |
11 Installation & Maintenance
Siting — The WMO Standard for Temperature Measurement
The WMO specifies temperature measurement at 1.25–2 meters (approximately 4–6.5 feet) above the ground surface, over a grass or representative natural surface, away from artificial surfaces that absorb or reflect radiation differently from natural surroundings. The sensor must be in the shade — shielded from direct solar radiation — while exposed to free airflow from all directions.
- Away from artificial heat sources: Paved surfaces, building facades, HVAC equipment, and parked vehicles all create local thermal anomalies that bias temperature readings away from true ambient conditions. Maintain at least 5–10 meters of separation from major heat sources.
- Away from water bodies and vegetation: Evaporative cooling from irrigation, water features, or dense vegetation creates local cool zones that don’t represent conditions across the broader facility. Mount the sensor in a representative location — typically a grassy or natural surface away from these features.
- Correct height: Mount the temperature sensor at 1.25–2 meters above the ground surface. Sensors mounted too high (above 3 meters) measure above the breathing zone and are increasingly decoupled from ground-level heat; sensors mounted on the ground surface measure soil-influenced temperatures, not air temperature.
- Avoid asphalt and concrete: These surfaces absorb solar radiation during the day and re-radiate it as heat in the late afternoon and evening, creating ‘urban heat island’ temperature readings that are significantly higher than true ambient air temperature. Mount the sensor over grass or natural ground where possible.
Maintenance
- Annual sensor verification: Compare the temperature sensor reading against a calibrated reference thermometer or nearby NWS/ASOS station during stable weather (early morning, no wind, overcast) when radiation errors are minimal. A persistent discrepancy of more than ±0.5°C warrants sensor inspection or recalibration.
- Shield cleaning: Clean the radiation shield interior annually to remove dust, pollen, insect debris, and biological material that accumulate on the shield surfaces and can alter its thermal and airflow properties. Use a soft brush and mild soap; rinse thoroughly and allow to dry completely before reinstalling the sensor.
- Aspiration verification (fan-aspirated shields only): Verify the aspirating fan operates at the specified flow rate. A degraded fan reduces airflow through the shield and increases solar radiation error. Replace fan motors at manufacturer-specified intervals or when reduced airflow is detected.
- Sensor element inspection: Inspect the sensor element for corrosion, moisture intrusion, or physical damage. Even small cracks in the sensor housing can introduce moisture that affects resistance readings and accuracy.
12 cyclonePort Temperature Monitoring System — Platform, Integration & Deployment
cyclonePort weather surveillance stations include a high-accuracy dry bulb temperature sensor with radiation shield as a core component of every standard configuration, delivering continuous air temperature data through RadarOmega alongside all other station sensor streams.
Technical Specifications
| Parameter | Specification |
|---|---|
| Sensor Technology | Platinum RTD (high-accuracy class); thermally stable across full operating range |
| Accuracy | ±0.2°C across the full outdoor operating range; factory-calibrated |
| Resolution | 0.01°C |
| Operating Range | –40°C to +60°C (–40°F to +140°F) |
| Response Time | Time constant <30 seconds in aspirated or well-ventilated shield |
| Radiation Shield | Radiation-shielded housing with passive ventilation; solar radiation error documented at manufacturer test conditions |
| Temperature Output | Dry bulb air temperature in °C and °F simultaneously |
| Derived Metric Output | Heat index (NWS Rothfusz formula with adjustments), wind chill (NWS 2001 formula), dew point, apparent temperature — all computed in real time in RadarOmega |
| Heat Index Range | Computed when T ≥ 80°F and RH ≥ 40%; displayed with NWS risk category label |
| Wind Chill Range | Computed when T ≤ 50°F and wind speed > 3 mph |
| Update Rate | Continuous; configurable summary intervals from 1 second to 60 minutes |
| Data Transmission | Cellular, Wi-Fi, or Ethernet depending on station model |
| Data Access | Web portal, mobile app, REST API via RadarOmega |
| Alerts | Configurable SMS/email for absolute temperature thresholds, heat index thresholds (NWS risk categories), wind chill thresholds (frostbite risk categories), and rate-of-change alerts for rapid temperature drops |
| Environmental Rating | IP65+; integrated into cyclonePort station housing |
| Station Lifespan | 10+ years with standard maintenance |
Specifications may vary by model. Contact cyclonePort for current engineering documentation.
What the System Delivers
- Continuous real-time dry bulb temperature — updated every second, displayed in °F and °C in RadarOmega
- Real-time heat index — NWS Rothfusz formula with NWS adjustments, displayed with risk category (Caution / Extreme Caution / Danger / Extreme Danger)
- Real-time wind chill — NWS 2001 formula, displayed with frostbite risk category when conditions are within valid range
- Dew point and apparent temperature — continuously calculated and displayed alongside dry bulb
- Temperature trend charts — 1-hour, 6-hour, 24-hour, and 7-day temperature history in RadarOmega
- Automated threshold alerts — SMS and email when temperature, heat index, or wind chill crosses user-defined thresholds
- OSHA heat index tier alerts — configurable alerts at the 80°F initial trigger and 90°F high-heat trigger thresholds
- Multi-station temperature comparison — view current temperature and heat index across all monitored facilities simultaneously
- Historical temperature archive — full record for compliance documentation, post-event review, and trend analysis
- Full weather picture — temperature alongside humidity, wind, pressure, rain, lightning, WBGT, and camera from the same station
Who Deploys cyclonePort Temperature Monitoring
| Sector | What cyclonePort Enables |
|---|---|
| Athletic Programs & Schools | Real-time heat index for summer practice safety and wind chill for winter operations. Combined with WBGT for complete heat stress characterization. Multi-campus monitoring for district safety officers. |
| Emergency Management | Heat wave situational awareness across a monitored jurisdiction. Cooling center activation triggers. Cold event public advisory support. Real-time temperature maps across facility networks. |
| Construction & Industry | OSHA heat safety compliance. Cold stress wind chill monitoring for winter outdoor operations. Timestamped records for compliance documentation. |
| Agriculture | Evapotranspiration inputs for irrigation scheduling. Frost risk monitoring with temperature and dew point. Livestock heat stress monitoring at facility level. |
| Utilities & Infrastructure | Ambient temperature monitoring for equipment loading and performance management. Cold weather de-icing and freeze protection decision support. Substation and remote infrastructure temperature monitoring. |
| Events & Municipalities | Heat index monitoring for outdoor public events and stadiums. Public advisory support. Multi-venue temperature comparison for park and recreation departments. |
Deploy Temperature Monitoring at Your Facility
cyclonePort temperature sensors are available as part of complete weather surveillance stations or as standalone deployments. Contact our team to configure accuracy specifications, shield type, alert thresholds, and derived metric outputs for your specific application. info@cycloneport.com · 844-737-9328 · cycloneport.com/contact
13 Frequently Asked Questions
What is dry bulb temperature and how is it different from other temperature measurements?
Dry bulb temperature (Tdb) is the actual ambient air temperature measured by a thermometer or electronic sensor that is shielded from radiation and moisture — the temperature you see in standard weather forecasts. The term ‘dry bulb’ distinguishes it from ‘wet bulb’ temperature, which is measured by a thermometer covered in a moistened wick; as water evaporates from the wick, the reading drops below the dry bulb temperature, with the difference between the two indicating the humidity of the air. Dry bulb temperature is the primary input for calculating heat index, wind chill, dew point, relative humidity, WBGT, and evapotranspiration.
What is the heat index and how is it calculated?
The heat index is the ‘apparent temperature’ — how hot the air feels to a person based on the combined effect of dry bulb temperature and relative humidity. It was developed by Robert Steadman in 1979 and formalized for NWS use via the Rothfusz regression equation. The formula is a multivariate polynomial in temperature (°F) and relative humidity (%) that approximates Steadman’s original biometeorological tables to within ±1.3°F. The NWS heat index formula is valid for temperatures at or above 80°F and relative humidity at or above 40%. When relative humidity exceeds 85% at temperatures between 80–87°F, or when humidity is below 13% at temperatures between 80–112°F, adjustment factors are applied to the base formula.
What is the NWS heat index danger scale?
The NWS classifies heat index into four escalating risk categories: Caution (80–90°F heat index) — fatigue possible with prolonged exposure; Extreme Caution (91–103°F) — heat cramps and exhaustion possible, heat stroke possible with extreme exertion; Danger (103–124°F) — heat cramps and exhaustion likely, heat stroke possible without exertion; Extreme Danger (125°F+) — heat stroke highly likely. These categories are calculated for shade conditions. Direct sunlight can increase the effective apparent temperature by up to 15°F beyond the calculated heat index, potentially shifting the risk category upward.
What is wind chill and when does it apply?
Wind chill is the apparent temperature that describes how cold air feels to a person due to the combined effect of air temperature and wind speed. Wind accelerates heat loss from exposed skin by disrupting the thin, warm air boundary layer that forms against the body surface, driving down skin temperature. The NWS/Environment Canada wind chill formula (adopted 2001) is: Wind Chill (°F) = 35.74 + 0.6215T – 35.75(V^0.16) + 0.4275T(V^0.16), where T is air temperature in °F and V is wind speed in mph. Wind chill is only defined for temperatures at or below 50°F and wind speeds above 3 mph. Direct sunshine may increase the apparent temperature by 10–18°F above the calculated wind chill.
Why does radiation shielding matter for outdoor temperature sensors?
Without proper shielding, a temperature sensor exposed to direct sunlight absorbs solar radiation and reads significantly higher than the actual air temperature — errors of 1–2°C (2–4°F) in bright, calm conditions are well-documented. These errors are not random; they are systematic and always in the direction of too warm, which means they occur precisely when the data is most critical for heat safety decisions — during the hottest, sunniest periods of the day. A professional radiation shield prevents direct solar heating of the sensor while allowing ambient air to flow across it, ensuring the reading represents the actual air temperature rather than the sensor’s own temperature.
What is the difference between heat index and WBGT for safety decisions?
Both heat index and WBGT express how hot conditions feel to the human body beyond the air temperature alone — but they differ fundamentally in how they capture the heat stress environment. Heat index uses only air temperature and relative humidity, is calculated for shade conditions, and assumes light wind and rest. WBGT adds solar radiation (via a physical black globe thermometer, 20% weight) and uses a natural wet bulb measurement (70% weight) in addition to dry bulb temperature (10%). Because WBGT directly measures solar radiation and more accurately models the conditions experienced by a physically active person in direct sun, it is the metric endorsed by OSHA, NIOSH, the U.S. military, NCAA, NFHS, and GHSA for occupational and athletic heat safety. For shade conditions and light activity, heat index is a reasonable approximation; for active outdoor populations in direct sunlight, WBGT is the appropriate metric.
How does cyclonePort calculate heat index and wind chill?
cyclonePort’s RadarOmega platform applies the NWS Rothfusz regression equation for heat index, including the low-humidity (RH <13%) and high-humidity (RH >85%) adjustment factors specified by the NWS. Heat index is computed and displayed in real time whenever the temperature is at or above 80°F and relative humidity is at or above 40%. For wind chill, RadarOmega applies the NWS 2001 formula whenever temperature is at or below 50°F and wind speed is greater than 3 mph. Both derived metrics are displayed alongside the raw temperature and humidity readings in the station dashboard with the applicable NWS risk category label.
What temperature accuracy is needed for heat index calculations?
For heat index calculations to be meaningful for safety decisions, the underlying temperature measurement should be accurate to ±0.5°C or better. A 1°C temperature error can produce a heat index error of 2–3°F, which can shift a reading across a risk category boundary — for example, from Caution to Extreme Caution — with direct operational consequences. cyclonePort temperature sensors achieve ±0.2°C accuracy, which produces a heat index error of approximately ±0.5°F from the temperature input alone.
Related Instruments & Guides
Wind direction is one component of the complete cyclonePort weather station. Explore related instrument pages:
↗ Wind Meter & Anemometer — Wind speed, gust measurement, and Beaufort/Saffir-Simpson context
↗ Barometric Pressure Sensor — Pressure trend analysis for front detection alongside directional wind data
↗ Lightning Detection System — Lightning detection integrated with wind direction for complete storm awareness
↗ WBGT Monitor & Heat Stress Sensor — Heat stress monitoring with wind direction context for heat index and comfort
↗ Temperature Sensor — Air temperature monitoring alongside wind chill and heat index calculation
↗ Humidity Sensor & Hygrometer — Relative humidity and dew point with wind direction for air mass characterization
↗ Rain Gauge — Precipitation monitoring alongside wind direction for storm tracking and front passage documentation
Related Instruments & Guides
Dry bulb temperature is the foundational input for every derived heat metric in the cyclonePort system. Explore related instrument pages:
↗ Humidity Sensor & Hygrometer — Relative humidity and dew point: the second input for heat index and dew point calculations [link]
↗ WBGT Monitor & Heat Stress Sensor — Wet bulb globe temperature: the professional heat stress standard that surpasses heat index for active outdoor populations [link]
↗ Wind Meter & Anemometer — Wind speed: the second input for wind chill calculations and storm approach detection [link]
↗ Barometric Pressure Sensor — Pressure trend analysis for storm forecasting alongside temperature data [link]
↗ Lightning Detection System — Lightning monitoring integrated with temperature and heat monitoring for complete outdoor safety [link]
↗ Rain Gauge — Precipitation monitoring alongside temperature for storm documentation and flood risk assessment [link]






Built for Severe Weather
Remote system management from anywhere
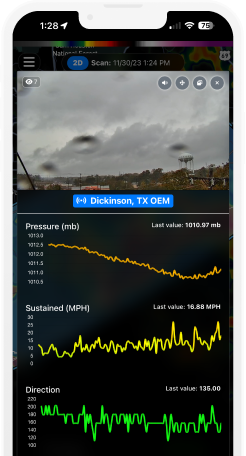
Deploy high-quality PTZ (Pan-Tilt-Zoom) IP cameras designed for effortless setup and immediate operation through plug-and-play simplicity. This advanced design significantly reduces installation time and complexity, making sophisticated surveillance accessible for businesses of all sizes. Multiple cameras connect seamlessly to the network.
Remote system management from anywhere
Deploy high-quality PTZ (Pan-Tilt-Zoom) IP cameras designed for effortless setup and immediate operation through plug-and-play simplicity. This advanced design significantly reduces installation time and complexity, making sophisticated surveillance accessible for businesses of all sizes. Multiple cameras connect seamlessly to the network.
Remote system management from anywhere
Deploy high-quality PTZ (Pan-Tilt-Zoom) IP cameras designed for effortless setup and immediate operation through plug-and-play simplicity. This advanced design significantly reduces installation time and complexity, making sophisticated surveillance accessible for businesses of all sizes. Multiple cameras connect seamlessly to the network.
Remote system management from anywhere
Deploy high-quality PTZ (Pan-Tilt-Zoom) IP cameras designed for effortless setup and immediate operation through plug-and-play simplicity. This advanced design significantly reduces installation time and complexity, making sophisticated surveillance accessible for businesses of all sizes. Multiple cameras connect seamlessly to the network.
Learn From The Field

- Guides
Cal/OSHA Heat Regulations for Outdoor Workers: What California Employers Must Know
- Guides
GCSAA Lightning Safety Guidance for Golf Courses: A Complete Compliance Guide