Weather Monitoring for Healthcare, Public Health & Safety Organizations

Support patient outcomes, protect outdoor staff, and fulfill public health weather monitoring mandates

Healthcare facilities, public health departments, and community safety organizations operate in a unique position: they are simultaneously responsible for the safety of their own staff and facilities, and for supporting the broader community’s health response during weather emergencies. Extreme heat kills more Americans than any other weather hazard. Air quality events linked to humidity and pressure systems trigger respiratory emergencies. cyclonePORT gives healthcare and public health organizations the real-time on-site data to act — not react.

We map your organization’s needs.

Plug-and-play hardware goes live.
Real-time data flows to your command center.

Why Healthcare Orgnizations Choose cyclonePORT

Hospitals, health departments, and public safety agencies rely on cyclonePORT for weather intelligence that directly supports patient care and community health:

  • Heat index monitoring: Track temperature and humidity for community heat health alerts and outdoor staff safety — OSHA compliance included.
  • Wet bulb temperature: Wet bulb readings directly support clinical heat illness risk assessment for vulnerable patient populations.
  • Lightning detection: Protect outdoor medical personnel, ambulance crews, and first responders working in weather-exposed environments.
  • Air quality proxy data: Barometric pressure, humidity, and wind data support asthma and respiratory event pattern analysis.
  • Timestamped documentation: All sensor readings are logged — supports public health surveillance, CDC reporting, and incident documentation.
  • Public dashboard options: Publish real-time weather data for community health transparency during heat emergencies or extreme weather events.

⚠ Heat Is the Deadliest Weather Hazard in America

The CDC reports that extreme heat kills more Americans annually than hurricanes, tornadoes, and floods combined.

Public health departments with on-site temperature monitoring are better positioned to issue timely heat emergency warnings and deploy cooling resources before heat-related illness peaks.

What You're Monitoring

cyclonePORT’s sensor suite captures every variable relevant to public health weather monitoring:

Specification

Detail

Temperature & Wet Bulb

Heat index and WBGT inputs — heat illness risk for patients and outdoor staff

Relative Humidity

Continuous RH% — heat stress and respiratory health correlation monitoring

Barometric Pressure

Storm system tracking — asthma and migraine trigger pattern analysis

Lightning Detection

Field staff and first responder safety alerts

Wind Speed & Direction

Outdoor event safety and air quality dispersion analysis

Precipitation

Flood and mold risk monitoring for facility management

Data Logging

Continuous timestamped records — public health surveillance and reporting

Public Data Access

Optional public dashboard for community weather health transparency


Capabilities

Built for Severe Weather

Harness advanced meteorological technology to track atmospheric conditions with precision. Our weather surveillance system provides instant alerts and detailed forecasts to keep you prepared. Real-time data from multiple sensors and satellites delivers actionable insights for informed decisions. Our platform combines historical patterns with current measurements for reliable forecasts.
01 Anemometer 02 PTZ Camera 03 Rain Gauge 04 Primary Sensor Housing 05 Wet Bulb Globe 06 CyclonePORT Hub
01.

The Pulse of the Sky

The anemometer is the “nervous system” of our weather stations. Moving beyond old-fashioned mechanical cups, our hardware utilizes ultrasonic sensor arrays to measure the velocity and direction of the wind. By calculating the time it takes for sound pulses to travel between sensors, it provides a lag-free, high-definition map of air movement.

02.

The PTZ Observation Unit

Our PTZ units are ruggedized optical sensors designed to withstand the very conditions they are monitoring. These aren’t just for recording video; they serve as a critical layer of visual ground-truthing. When our sensors detect a change in wind speed or pressure, the PTZ camera can automatically swivel to the point of interest—allowing us to see the formation of wall clouds, debris, or precipitation in real-time.

The lens moves vertically, allowing for a look at both high-altitude cloud formations and ground-level impacts

03.

Liquid Precision: 
The Smart Rain Gauge

The rain gauge is the primary component for measuring precipitation intensity and accumulation. Our systems typically utilize “Tipping Bucket” or “Optical” technology to provide high-resolution data. As droplets enter the collector, the sensor logs the volume in real-time, allowing our AI to calculate rainfall rates per minute.

04.

Resilience by Design: 
The Primary Sensor Housing

The Primary Sensor Housing is the ruggedized enclosure that integrates and protects the suite of meteorological instruments. It isn’t just a box; it is a precision-engineered environment. Designed with aerodynamic stability and thermal regulation, it ensures that internal components—like barometers, data loggers, and transmission hardware—stay dry, cool, and connected even in hurricane-force winds or sub-zero blizzards.

05.

Human-Centric Heat Intelligence

The Wet Bulb Globe is the “biometric” sensor of our weather stations. It doesn’t just measure ambient air; it accounts for the three-way punch of temperature, humidity, and solar radiation. By simulating how a human being absorbs heat while sweating in direct sunlight, it provides the Wet Bulb Globe Temperature (WBGT)—the most accurate metric for predicting heat exhaustion and sunstroke.

For companies managing outdoor crews, sports events, or high-load data centers, this sensor is the definitive “go/no-go” signal for safety.

06.

The Intelligence Engine: CyclonePORT Hub

The CyclonePORT Hub is the central nervous system of our weather monitoring architecture. It serves as the high-speed bridge between raw environmental data and actionable cloud intelligence. While our sensors are busy “feeling” the storm, the Hub is busy translating those signals, encrypting the data, and ensuring it reaches our forecasting models in milliseconds—even when local power grids or traditional networks fail.

It is designed for “Edge Computing,” meaning it processes critical data locally to provide instant alerts before the information even hits the cloud.

Platform Features at a Glance for Healthcare

Specification

Detail

Deployment

Permanent campus installation or portable field deployment

Power Options

Grid-connected or solar — for facility rooftops or remote field sites

Public Dashboard

Optional — share real-time data with the community during weather emergencies

Alert System

Heat, lightning, and severe weather alerts to staff and field personnel via app

Data Logging

Continuous timestamped records — public health surveillance and CMS compliance

Multi-Site

Monitor multiple facility and field locations from one organizational account

Regulatory & Standards Alignment for Healthcare & Public Health

cyclonePORT supports compliance with the health and safety standards that govern healthcare facilities and public health operations:

  • OSHA Heat Illness Prevention standard — outdoor healthcare and EMS worker protection
  • CMS (Centers for Medicare & Medicaid Services) emergency preparedness requirements — weather monitoring provisions
  • CDC Heat and Health Tracker program — local heat data integration
  • Joint Commission Environment of Care standards — outdoor campus safety monitoring
  • State public health emergency preparedness regulations — weather event response documentation

Support Your Community — Not Just Your Facility

cyclonePORT data can be shared publicly through a configurable dashboard, allowing health departments to provide transparent, real-time local weather data to community members during heat emergencies, air quality events, and severe weather situations.

Common Use Cases

Hospital Campus Environmental Monitoring

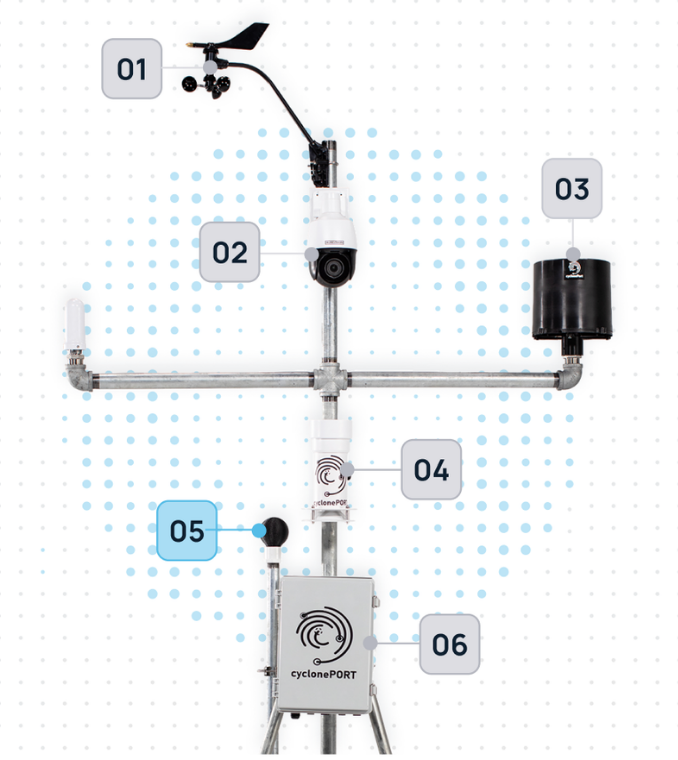
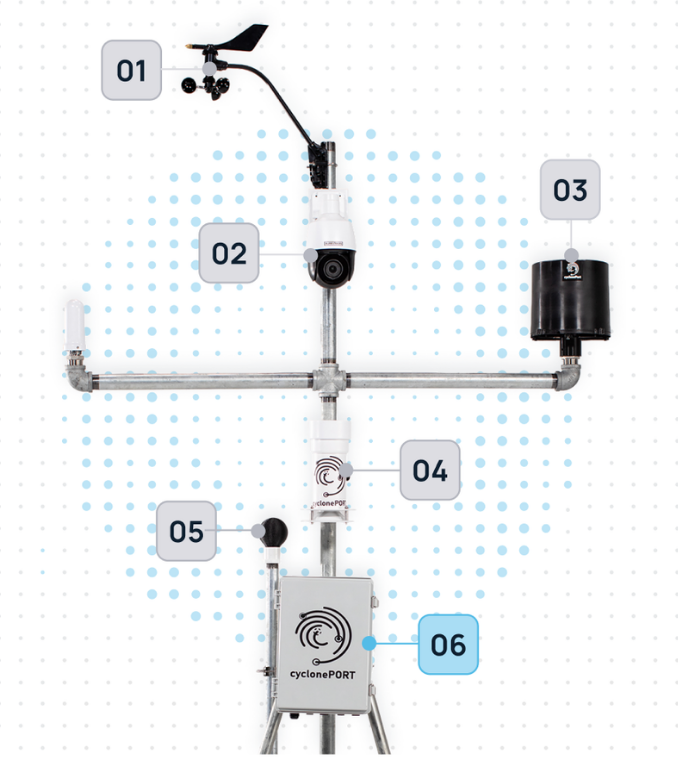
Large hospital campuses have outdoor spaces — patient transport areas, outdoor dining, exterior walkways — where extreme heat, lightning, and severe weather create safety risks for patients, visitors, and staff. A permanent cyclonePORT installation provides facilities management and safety staff with real-time campus weather data and automated alerts.

Public Health Heat Emergency Response

Public health departments managing community heat emergency protocols need accurate local temperature and humidity data — not regional averages. cyclonePORT provides on-site monitoring that can trigger community heat advisory systems, cooling center activations, and outreach to vulnerable populations at the right threshold, not an averaged regional estimate.

EMS and Field Medical Team Safety

Paramedics, EMTs, and field public health workers operating in outdoor environments face lightning, heat, and severe weather risks. cyclonePORT’s app-based alert system delivers real-time weather safety alerts to field personnel across the response area simultaneously.

Results

When Seconds Decide Outcomes

Our real-world projects demonstrate strategic direction translating into measurable impact. Through documented client successes, we showcase tangible outcomes—from enhanced efficiency to transformed business results. These authentic stories reveal how our solutions address specific challenges, adapt to unique circumstances, and empower organizations to achieve their goals. Each case study represents proven expertise in action.

A county emergency management agency detected rotation

Live video feeds from cyclonePORT stations caught the storm’s development before radar confirmation. Real-time wind data and pressure readings gave forecasters the intelligence needed to issue warnings minutes earlier than traditional methods allowed.

Emergency crews coordinated faster with shared data

When the warning went out, first responders already had access to the same video feeds and sensor data as the emergency operations center. Utility crews knew exactly where to position equipment. Fire departments staged resources based on confirmed wind speeds rather than estimates.

Frequently Asked Questions

How can cyclonePORT support our hospital's heat emergency protocol?

cyclonePORT monitors real-time temperature and humidity at your campus location and delivers configurable alerts when heat index thresholds are reached. All readings are automatically logged, supporting documentation of facility weather monitoring for accreditation and emergency preparedness reviews.

Yes. cyclonePORT data logs provide granular local temperature and humidity records that can complement CDC Heat and Health Tracker programs and local public health surveillance activities. Optional public dashboard access can make this data transparent to the community.

cyclonePORT’s multi-site platform supports monitoring of multiple locations from a single organizational dashboard. Each site provides its own independent real-time data stream.

cyclonePORT’s continuous timestamped data logging and configurable alert documentation support the weather monitoring components of CMS emergency preparedness requirements. Contact our team for specific documentation templates and compliance support resources.

Protect Your Patients, Staff, and Community
with Professional Weather Monitoring

Contact our team about healthcare campus deployments, public health integrations, and compliance documentation support.

cycloneport.com/contact  |  info@cycloneport.com  |  844-737-9328