Humidity Sensor & Hygrometer
Professional-grade humidity measurement for weather surveillance networks, emergency management, broadcast operations, and critical infrastructure monitoring.
Contents
01 The Instrument — What It Measures and Why It Matters
02 Measurement Types — Relative Humidity, Absolute Humidity, Dew Point
03 Sensor Technology — How cyclonePort Captures Humidity Data
04 Operational Applications — What the Data Enables
05 Instrument Selection Guide — Specs That Matter in the Field
06 Installation & Maintenance — Siting, Calibration & Care
07 cyclonePort Humidity System — Platform, Integration & Deployment
08 Frequently Asked Questions

- 2% RH
- - 100% RH
- RH - Dewpoint - Temp
- RadarOmega
01 The Instrument — What It Measures and Why It Matters
A humidity sensor is the electronic transducer at the core of any hygrometer — the component that responds to changes in atmospheric moisture and converts that response into a measurable electrical signal. A hygrometer is the complete instrument: sensor element, signal conditioning, and data output, packaged for continuous field deployment.
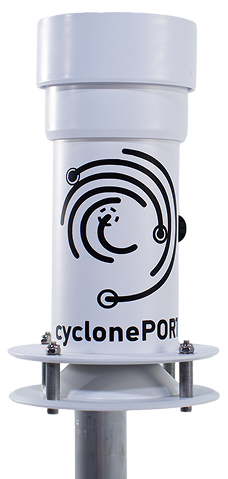
In the cyclonePort weather surveillance system, humidity measurement is delivered through a custom-engineered sensor housing that integrates a calibrated capacitive sensing element with radiation shielding and optimized airflow geometry. The result is instrument-grade RH and dew point data — not an approximation pulled from a regional airport station miles away, but a live reading from your exact location.
Why this distinction matters Consumer hygrometers are designed to display a number. Professional weather instruments are designed to deliver accurate, continuous, networkable data — with the housing engineering, calibration traceability, and platform integration that safety-critical and operationally-critical decisions require. |
Humidity is not a secondary parameter. Without it, weather stations cannot accurately report heat index, calculate dew point, or feed WBGT algorithms. Every safety decision made from weather data — from suspending outdoor athletic events to staging utility line crews ahead of a storm — depends on humidity data being accurate and current.
02 Measurement Types — Relative Humidity, Absolute Humidity & Dew Point
Humidity is not a single metric — it can be expressed in three forms, each with distinct physical meaning and operational utility. cyclonePort instruments output relative humidity and dew point as continuous real-time streams; absolute humidity is a derived calculation available through the RadarOmega platform.
Relative Humidity (RH)
Specification: Relative Humidity |
Unit: Percentage (%) |
Formula: RH = (Actual Vapor Pressure / Saturation Vapor Pressure) × 100 |
Measurement range: 0% to 100% |
Temperature dependency: Yes — RH changes as temperature changes, even with constant moisture content |
cyclonePort output: Continuous real-time stream, logged and accessible via RadarOmega |
Relative humidity is the ratio of the air’s current water-vapor content to the maximum it could hold at the same temperature, expressed as a percentage. Because warm air can hold more water vapor than cool air, RH changes when temperature changes even if the actual moisture content stays the same. This makes RH familiar and useful, but sometimes misleading when comparing moisture conditions across different temperatures.
At 100% RH, the air is saturated and condensation can occur. General context ranges:
Operational thresholds monitored by cyclonePort networks:
- 30–60% RH: Standard comfortable range for occupied indoor and outdoor environments
- Above 60% RH: Elevated mold growth, structural moisture risk, HVAC load increase
- Below 30% RH: Respiratory discomfort, static electricity, dehydration risk
- Very low RH combined with wind and dry fuels: may contribute to critical fire-weather conditions, depending on region
Absolute Humidity (AH)
Specification: Absolute Humidity |
Unit: Grams per cubic meter (g/m³) |
Formula: AH = Mass of Water Vapor / Volume of Air |
Temperature dependency: No — reflects true moisture content regardless of temperature |
cyclonePort output: Derived calculation from RH + temperature; available in RadarOmega |
Absolute humidity is the mass of water vapor per unit volume of air, usually expressed in grams per cubic meter. It is a more direct measure of moisture amount than RH, but because it is volume-based, it can still change as the air expands or contracts. For many outdoor weather applications, dew point is usually a more stable and operationally useful indicator of atmospheric moisture.
For most field weather monitoring applications, RH and dew point are the operationally preferred outputs. Absolute humidity becomes the primary metric in industrial process monitoring, agricultural storage and greenhouse management, pharmaceutical manufacturing environments, and scientific research contexts where true moisture load — not saturation ratio — drives decisions.
Dew Point
Specification: Dew Point |
Unit: Degrees Fahrenheit (°F) or Celsius (°C) |
Definition: The temperature to which air must be cooled for condensation to begin at constant pressure |
Temperature dependency: No — a stable, direct indicator of atmospheric moisture content |
cyclonePort output: Continuous real-time stream, displayed alongside RH and temperature |
Dew point is the temperature to which air must be cooled, at constant pressure and unchanged water-vapor content, for saturation to occur. It is expressed as a temperature rather than a percentage. Because it is much less sensitive to ordinary daytime temperature swings than RH, dew point is often the preferred metric for representing actual atmospheric moisture.
Dew point is especially useful in forecasting and operations because it tracks moisture content more consistently than RH. It is commonly used in convective weather analysis, air-mass identification, and heat-stress awareness.
Dew point operational thresholds:
- Below 55°F: Comfortable — low moisture, minimal heat stress contribution
- 55°F–60°F: Noticeable humidity, some discomfort during exertion
- 60°F–65°F: Humid — elevated heat stress monitoring warranted
- 65°F–70°F: Oppressive — triggers heat stress protocols in athletic and occupational settings
- Above 70°F: Extreme — associated with dangerous heat index values and rapid heat illness onset
At a Glance: RH vs. Absolute Humidity vs. Dew Point
Parameter | Value |
|---|---|
Relative Humidity | |
Unit | Percentage (%) |
Changes with temperature? | Yes |
Stable daily indicator? | No — fluctuates through the day |
Primary use cases | General weather reporting, HVAC, comfort, mold risk, heat index |
cyclonePort output | Continuous real-time stream |
Absolute Humidity | |
Unit | g/m³ |
Changes with temperature? | No |
Stable daily indicator? | Yes |
Primary use cases | Industrial processes, agriculture, pharmaceutical, scientific research |
cyclonePort output | Derived from RH + temperature in RadarOmega |
Dew Point | |
Unit | °F or °C |
Changes with temperature? | No |
Stable daily indicator? | Yes |
Primary use cases | Storm forecasting, heat stress monitoring, fire weather, aviation, infrastructure |
cyclonePort output | Continuous real-time stream |
03 Sensor Technology — How cyclonePort Captures Humidity Data
The accuracy of a humidity measurement depends on two equally important factors: the sensing element that detects moisture, and the housing that governs what air the sensor actually measures. Getting one right while neglecting the other produces unreliable data.
Capacitive Sensing — The Technology Inside cyclonePort Instruments
cyclonePort sensor housings use capacitive humidity sensing — the method of choice for instrument-grade weather monitoring applications. A capacitive sensor sandwiches a moisture-absorbing polymer or metal oxide dielectric material between two electrodes. As atmospheric water vapor is absorbed into the dielectric, the electrical capacitance of the resulting capacitor changes. That change is measured, signal-conditioned, and converted into a calibrated humidity reading.
Why capacitive sensing is the professional standard Capacitive sensors deliver ±2% RH accuracy across the full 0–100% RH range, exhibit good long-term stability, resist condensation, and perform reliably across a wide temperature range. These characteristics make them the sensor technology of choice in professional meteorological, industrial, and aviation-grade instruments — as opposed to resistive sensors, which trade accuracy for cost and are unsuitable for precision environmental monitoring. |
Resistive Sensors — A Reference Point
Resistive humidity sensors measure changes in the electrical impedance of a hygroscopic material (typically a conductive polymer or salt) as it absorbs moisture. They are lower cost and physically smaller than capacitive sensors but deliver significantly less precision — particularly below 20% RH — and are more susceptible to chemical contamination and drift. Resistive sensors are appropriate for basic commercial HVAC applications, not for safety-critical or operationally-critical weather monitoring.
Thermal Conductivity Sensors — Absolute Humidity Direct Measurement
Thermal conductivity (or ‘absolute humidity’) sensors measure the thermal conductivity of air against a sealed dry reference and use the difference to calculate absolute humidity directly. They are used almost exclusively in industrial process environments where absolute moisture load — not relative saturation — is the governing variable. cyclonePort derives absolute humidity from RH and temperature, which is the standard approach in field-deployed weather instrumentation.
Housing Engineering — The Other Half of Accuracy
A calibrated sensor in a poorly designed housing returns inaccurate data. Solar radiation heating an enclosure can inflate temperature readings, which in turn distort RH calculations. Stagnant air inside a sealed housing means the sensor is measuring a pocket of air that stopped being representative hours ago.
cyclonePort uses a custom-engineered sensor housing system specifically designed to allow efficient airflow for accurate environmental readings while shielding the sensing elements from direct solar radiation. The housing geometry promotes natural convective airflow across the sensor element, ensuring continuous exchange with true ambient air — the same engineering principle employed in professional-grade radiation shields used by NOAA and the National Weather Service.
04 Operational Applications — What Humidity Data Enables
Heat Stress and WBGT Monitoring
Humidity is a key input in many operational heat-stress calculations. Heat index combines air temperature with humidity to estimate apparent temperature, while WBGT incorporates additional environmental factors such as solar radiation and wind to better represent thermal stress during outdoor activity. Continuous humidity and temperature data are therefore important in athletic, occupational, and event-safety monitoring, especially where WBGT-based procedures are used.
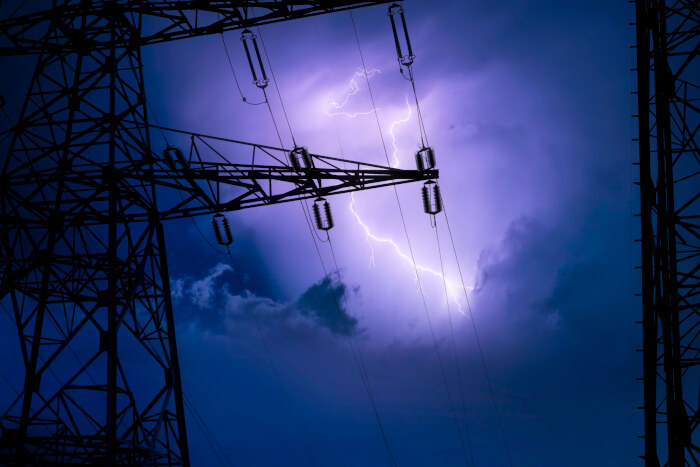
Severe Weather Analysis and Forecasting
Dense ground-level humidity networks can reveal local moisture gradients and boundary signatures that are difficult to characterize from sparse stations alone. Sudden dew point changes may help identify outflow boundaries, air-mass transitions, or zones of enhanced low-level moisture. This kind of site-specific moisture information can improve situational awareness for meteorologists and emergency managers during convective weather.
Fire Weather Monitoring
Relative humidity is a key factor in fire-weather assessment because very dry air can accelerate fuel drying and increase fire danger when combined with wind and dry fuels. Red Flag criteria often include low RH and elevated wind, though exact thresholds vary by region. Distributed humidity measurements can help identify local dry pockets and terrain-driven moisture differences that broader regional networks may miss.
Infrastructure and Utility Operations
Humidity and dew point data can help infrastructure operators assess condensation, fog potential, icing risk, and other moisture-related hazards. In transportation and utility settings, these measurements are most useful when combined with temperature, wind, and site exposure to improve operational awareness and maintenance planning.
05 Instrument Selection Guide — Specs That Matter in the Field
Not all humidity instruments are equivalent. In professional weather surveillance deployments, the gap between a consumer-grade hygrometer and an instrument-grade sensor package can mean the difference between reliable operational data and expensive misinformation. These are the specifications that matter.
Specification | What to Require |
|---|---|
Accuracy | Instrument grade: ±2% RH or better (20–80% RH range). Consumer grade: ±5–10% RH — insufficient for safety-critical applications, storm analysis, or regulatory compliance. |
Measurement Range | Full 0–100% RH range required. Rapidly evolving conditions — thunderstorm passages, coastal locations, fire weather transitions — regularly reach the limits of partial-range sensors. |
Response Time | Fast sensor response captures the humidity signature of outflow boundaries, storm passages, and fog formation events. Slow-response sensors miss the meteorologically significant edge. |
Housing & Radiation Shield | Multi-plate radiation shielding and engineered airflow geometry are non-negotiable for outdoor deployment. Solar heating of a poorly designed enclosure corrupts temperature and therefore RH readings regardless of sensor precision. |
Network Integration | A standalone hygrometer delivers a number. A networked instrument delivers data — historically logged, remotely accessible, alert-enabled, and comparable across multiple locations simultaneously. Verify platform integration before hardware selection. |
Calibration & Drift | All humidity sensors drift with age. Instrument-grade systems include calibration documentation and support periodic recalibration without full hardware replacement. Verify manufacturer calibration intervals and field recalibration procedures. |
Environmental Rating | Outdoor sensors in active weather environments must withstand precipitation, UV exposure, temperature extremes, insects, and physical impact. Verify ingress protection ratings and operating temperature ranges before deployment. |
Data Output Format | Confirm compatibility with your monitoring platform. Professional instruments output industry-standard protocols (Modbus, SDI-12, JSON API) rather than proprietary closed formats that create long-term vendor lock-in. |
06 Installation & Maintenance
Proper siting and routine maintenance account for the majority of real-world accuracy variation between professional-grade deployments and underperforming ones. cyclonePort provides station-specific mounting guidance, but these principles apply universally.
Sensor Placement Best Practices
- Mount at standard weather-observation height — 1.5 to 2 meters above ground, or at rooftop level where ground-level siting is impractical
- Maintain a minimum 3-meter clearance from building walls to reduce radiant heat contamination
- Avoid proximity to artificial moisture sources: vent exhausts, cooling towers, irrigation sprinklers, and HVAC discharge points
- Ensure unobstructed airflow — dense hedges, solid fences, and corner pockets trap stagnant air and produce readings that lag or misrepresent actual ambient conditions
- Keep sensor away from heat-reflective surfaces: metal roofing, dark pavement, and south-facing masonry can elevate local temperature and suppress apparent RH
- Always use the supplied radiation shield — never operate the sensor element exposed to direct solar radiation
Typical installation time Under one hour with standard tools. cyclonePort supplies mounting hardware for pole mounts, wall brackets, and rooftop masts. Contact our team for site-specific guidance on non-standard installations. |
Calibration
All cyclonePort humidity sensors are factory-calibrated at multiple humidity points using NIST-traceable reference salt solutions and climate chambers before shipping. No field calibration is required under normal operating conditions — sensors leave the factory verified and ready to deploy.
For critical applications — research facilities, greenhouse operations, pharmaceutical environments — optional annual verification using a saturated salt test kit provides additional confidence. cyclonePort support can assist with calibration verification procedures for these use cases.
Routine Maintenance
- Periodic visual inspection of the sensor housing and radiation shield for dust accumulation, insect intrusion, and physical debris
- Gentle cleaning with a soft brush or low-pressure compressed air — do not use high-pressure washing, solvents, or abrasive materials on sensing elements
- Check housing integrity and connector weatherproofing annually, or after exposure to extreme weather events
- Long-term drift is typically less than ±1% RH per year under normal outdoor conditions; contamination from industrial emissions or salt spray may require more frequent inspection in affected environments
When to Contact Support
Contact cyclonePort support if: readings appear stuck near 100% RH for an extended period (indicating possible saturation or sensor damage); readings persistently differ from nearby official stations by more than 5% RH after accounting for known microclimate differences; or sensor response appears sluggish following contamination exposure.
Note: temporary saturation can occur during heavy precipitation or condensation events. In most cases, the sensor recovers fully as moisture evaporates — sustained saturation readings beyond a few hours warrant diagnostic review.
07 cyclonePort Humidity Monitoring System
cyclonePort weather surveillance stations deliver humidity, dew point, temperature, and barometric pressure through a custom-engineered sensor housing, with all data logged continuously and accessible through RadarOmega — our cloud-based monitoring, visualization, and alerting platform.
Technical Specifications
Parameter | Specification |
|---|---|
Measurement Range | 0–100% RH (non-condensing recommended for optimal long-term stability) |
Accuracy | ±2–3% RH (20–80% RH range, 10–40°C operating window) |
Resolution | 0.1% RH |
Operating Temp | –40°C to +60°C (–40°F to +140°F) |
Response Time | <15 seconds for a 30–80% RH step change in moving air |
Long-Term Drift | <±1% RH/year under typical outdoor conditions |
Calibration | Factory-calibrated against NIST-traceable reference standards; no field calibration required under normal conditions |
Power Consumption | Ultra-low (microamp average); solar-compatible for remote deployments |
Data Logging | Configurable 1–5 minute intervals; stored locally and transmitted to cloud |
Transmission | Cellular, Wi-Fi, or Ethernet depending on station model |
Data Access | Web portal, mobile app, REST API |
Export Formats | CSV and JSON; SCADA and BMS integration available via API |
Output | Digital; integrated into cyclonePort data logger and RadarOmega platform |
Specifications may vary by model. Contact cyclonePort for current engineering documentation.
What the System Delivers
- Continuous real-time relative humidity at ±2% RH accuracy
- Dew point calculated and displayed alongside RH and temperature as a live data stream
- Absolute humidity available as a derived output in RadarOmega
- Historical sensor data with full chart viewer — compare conditions across events, seasons, and station locations
- Multi-station network view — monitor and compare humidity across your entire deployment simultaneously
- PTZ IP camera integration — correlate live video with sensor readings at every station
- Remote system access — manage station configuration, access data, and control hardware from any location via RadarOmega
- Flexible deployment — single-site monitoring to large distributed networks
Who Deploys cyclonePort
Sector | What cyclonePort Enables |
|---|---|
Emergency Management | Real-time RH and dew point monitoring for heat emergency declarations, fire weather tracking, and severe storm response. Multi-agency data sharing built into the platform architecture. |
Broadcast Media | Hyperlocal humidity data for weather operations and on-air visualization. Replace approximations with live readings from your coverage area’s specific locations. |
Utilities & Power | Continuous humidity monitoring across infrastructure corridors for icing prediction, fog formation anticipation, vegetation management timing, and storm crew deployment. |
Commercial & Institutional | Campus, athletic facility, military installation, and large venue environmental monitoring. One platform for humidity, temperature, wind, pressure, and camera surveillance. |
Build Your Humidity Monitoring Network cyclonePort scales from a single monitoring site to large multi-location sensor networks. Contact our team to discuss your deployment — hardware, platform configuration, and network architecture.info@cycloneport.com · 844-737-9328 · cycloneport.com/contact |
08 Frequently Asked Questions
What is the difference between a humidity sensor and a hygrometer?
A humidity sensor is the sensing element that responds to atmospheric moisture, while a hygrometer is the complete instrument that measures and reports humidity.
What is relative humidity and why does it change through the day?
Relative humidity is the percentage of saturation at the current temperature. It often changes through the day because air temperature changes alter how much water vapor the air can hold.
What is the difference between relative humidity and dew point?
Relative humidity depends strongly on temperature, while dew point is generally a more stable indicator of actual atmospheric moisture when moisture content is unchanged.
What is absolute humidity and when is it the right measurement to use?
Absolute humidity measures water vapor per unit volume of air. It is especially useful in industrial, agricultural, and controlled-environment applications.
What dew point temperature indicates dangerous heat-humidity conditions?
Higher dew points increase heat stress potential, but the actual danger depends on temperature, sun exposure, exertion, wind, and the heat-safety method being used.
How accurate are professional-grade humidity sensors compared to consumer hygrometers?
Professional sensors usually offer better accuracy and long-term stability than consumer hygrometers, but exact specifications depend on the model and conditions.
Why does sensor housing design matter for humidity accuracy?
Because shielding and airflow determine whether the sensor is measuring true ambient air or a locally heated, stagnant microenvironment.
How often does the cyclonePort humidity sensor need to be calibrated?
Factory calibration holds for 1–2 years under normal outdoor operating conditions with no field calibration required. Critical applications — research, greenhouses, pharmaceutical environments — may benefit from optional annual verification using a saturated salt test kit. Contact cyclonePort support if you observe persistent drift or readings that deviate significantly from nearby reference stations.
What happens if the humidity sensor gets saturated or iced over during a weather event?
Temporary saturation can occur during heavy precipitation or conditions where condensation forms directly on the sensor element. In most cases, the sensor recovers fully as moisture evaporates or ice melts — typically within minutes to a few hours after conditions normalize. If readings remain stuck near 100% RH for an extended period following an event, contact cyclonePort support for diagnostics.
Related Instruments & Guides
This page is part of the cyclonePort humidity measurement resource library. For in-depth coverage of each measurement type:
↗ Relative Humidity Sensors — How RH is measured, heat index and WBGT applications, and sensor selection for safety monitoring [link]
↗ Absolute Humidity Sensors — Industrial and agricultural applications, derived calculations, and absolute vs. relative comparison [link]
↗ Dew Point Sensors — Dew point in severe weather forecasting, heat stress protocols, and infrastructure monitoring [link]


Built for Severe Weather
The Pulse of the Sky
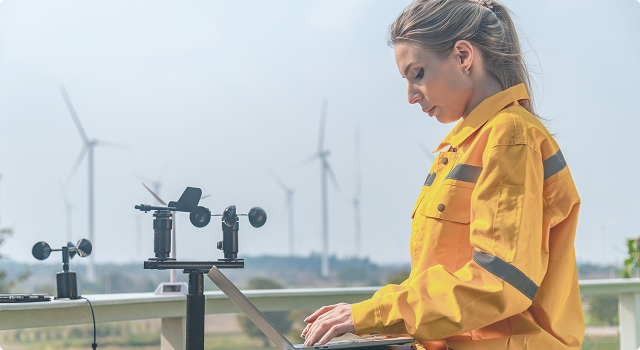
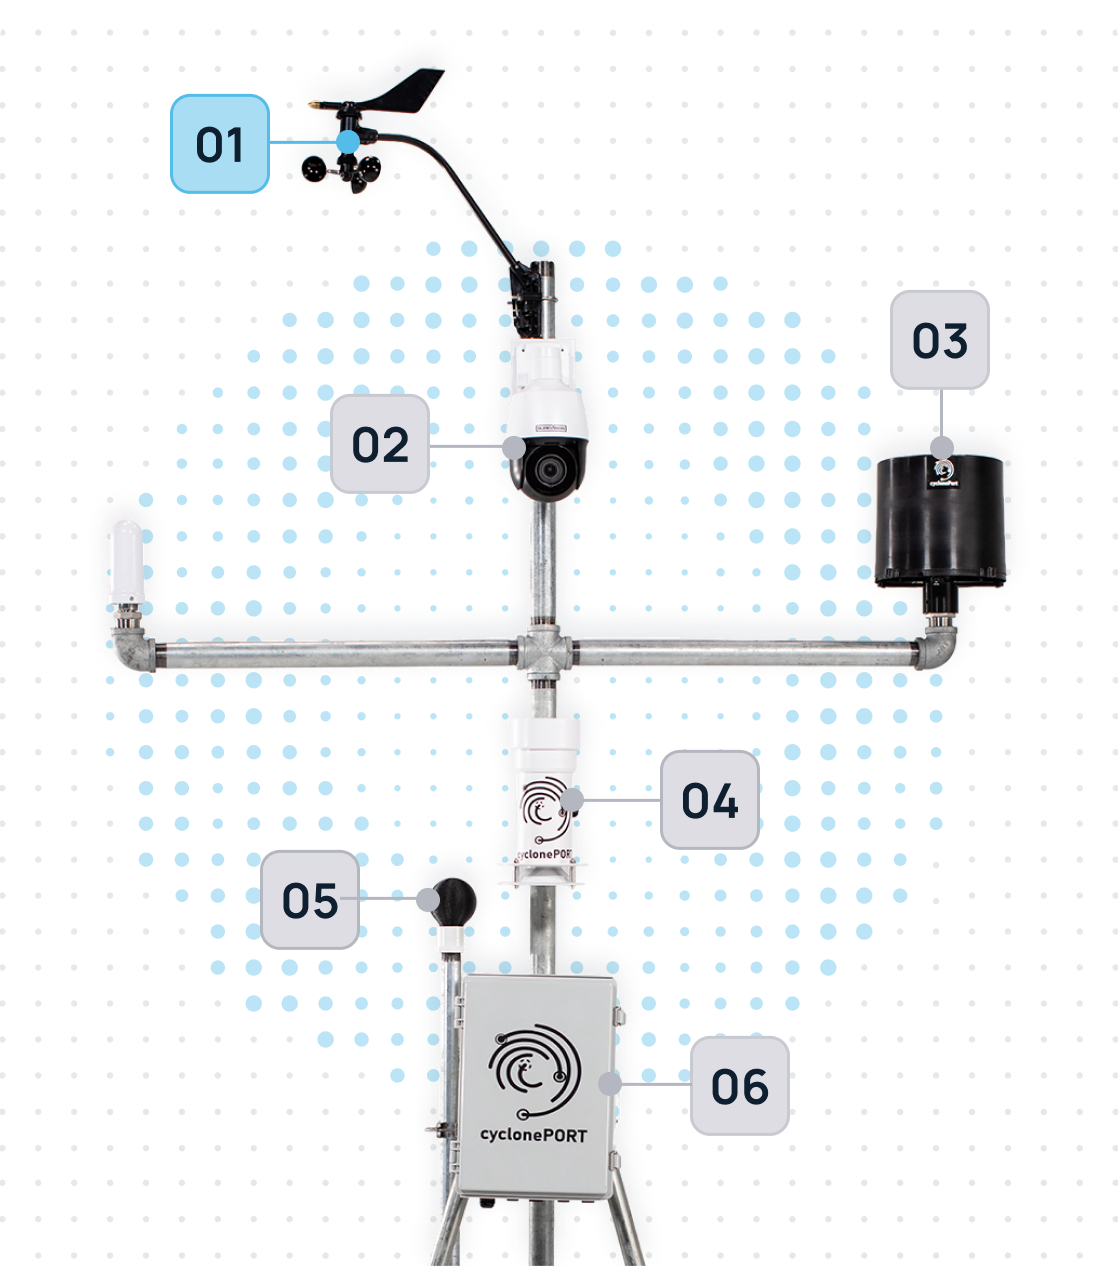
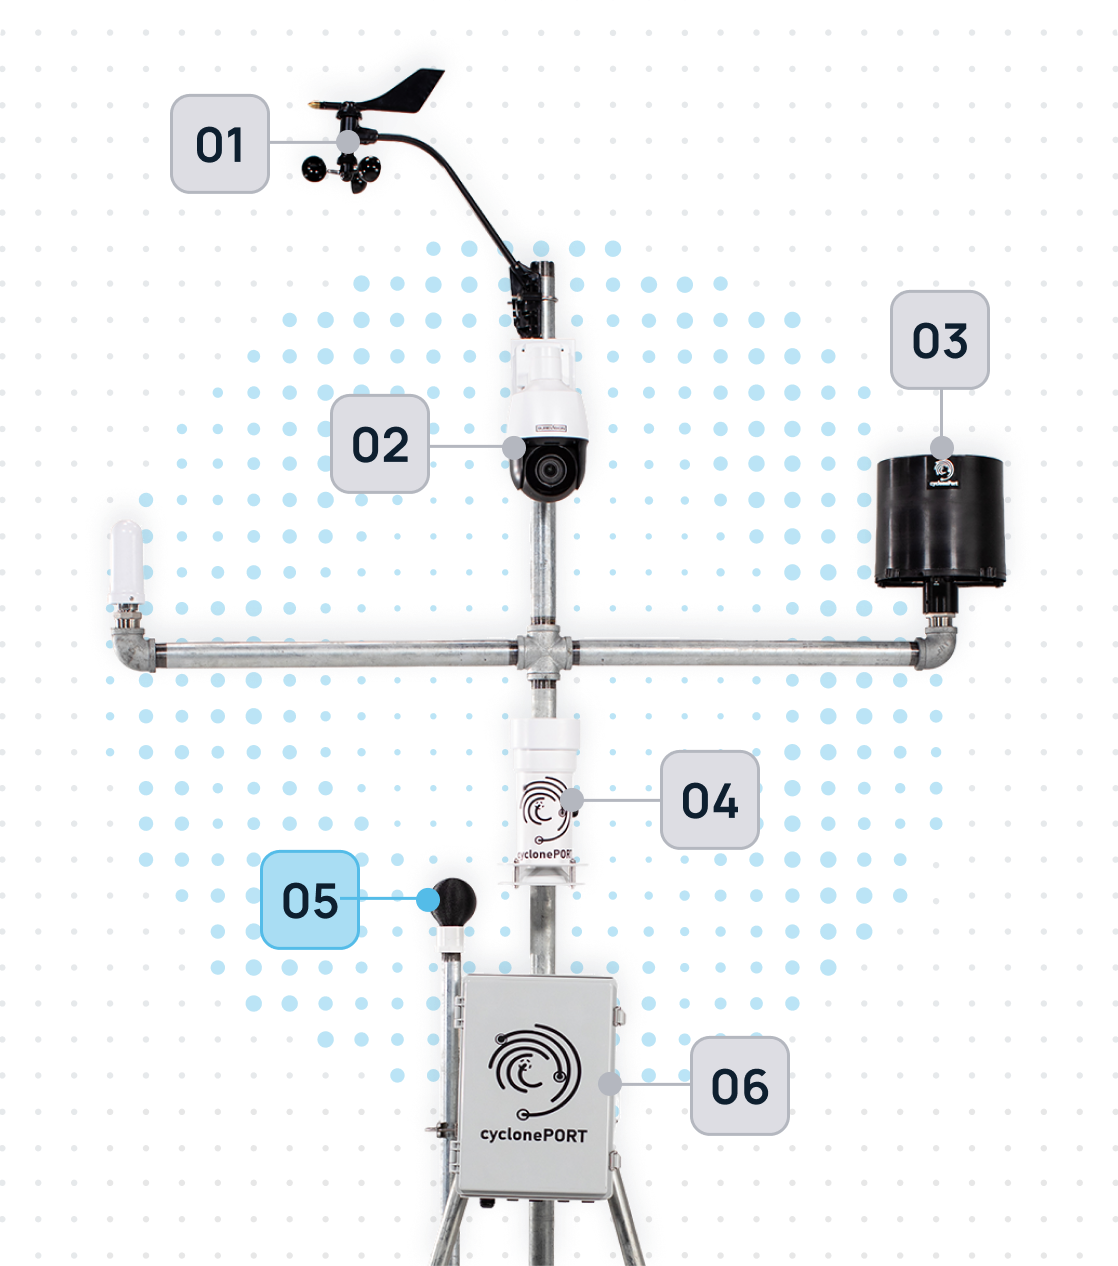
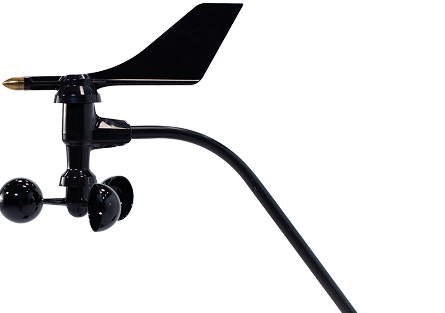
The anemometer is the “nervous system” of our weather stations. Moving beyond old-fashioned mechanical cups, our hardware utilizes ultrasonic sensor arrays to measure the velocity and direction of the wind. By calculating the time it takes for sound pulses to travel between sensors, it provides a lag-free, high-definition map of air movement.
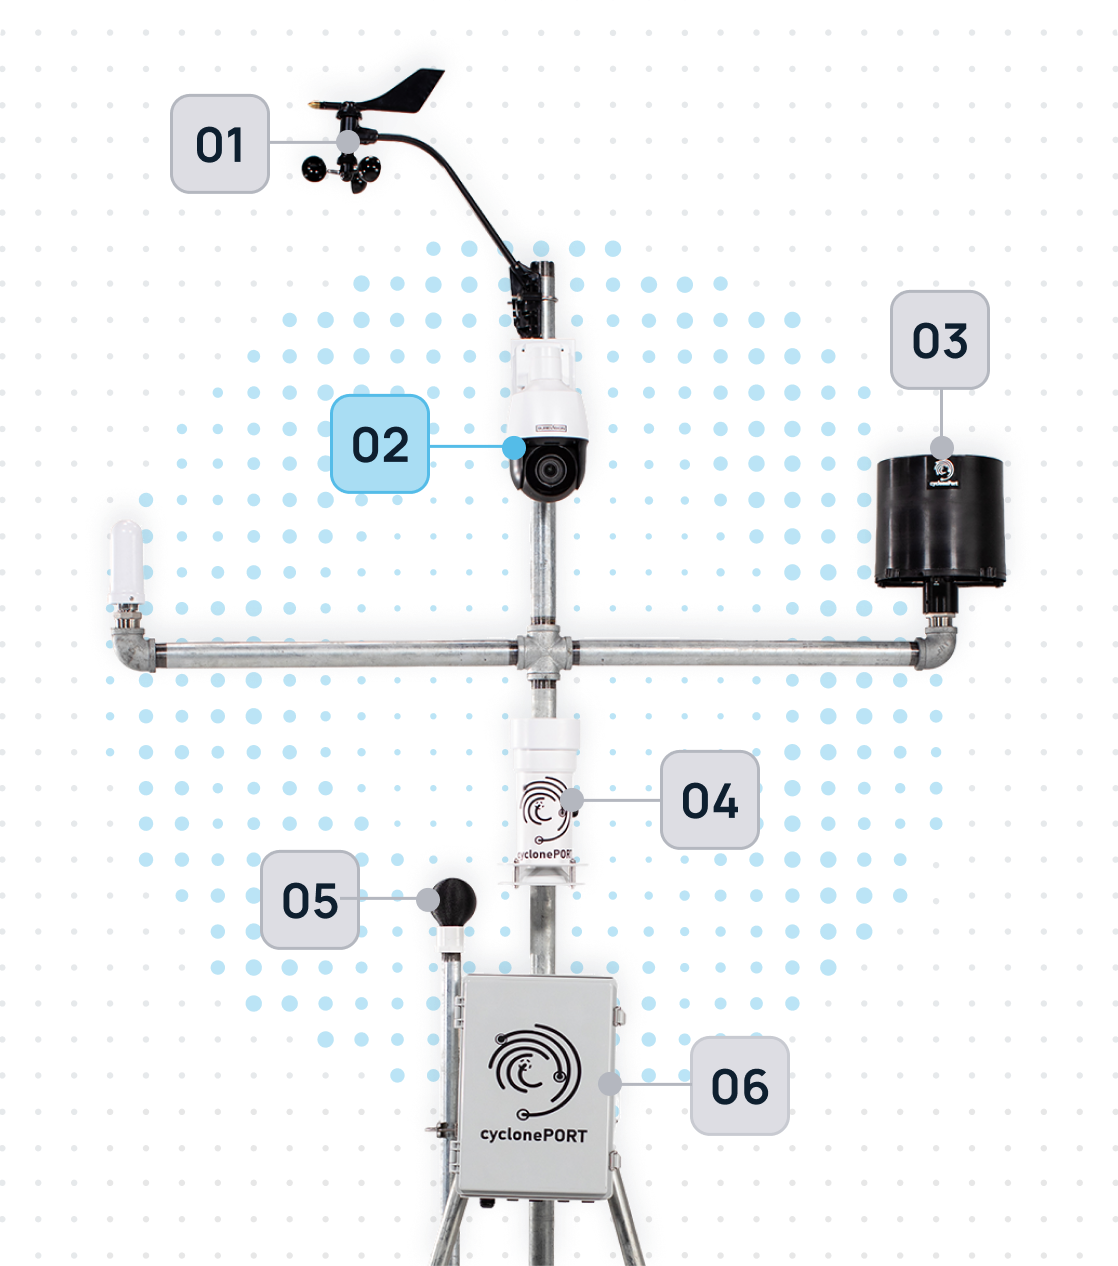
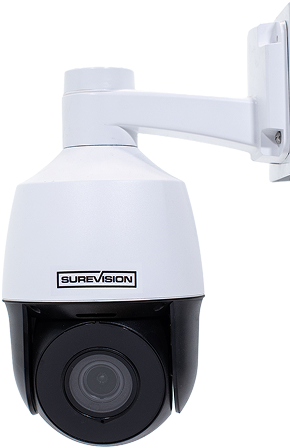
The PTZ Observation Unit
Our PTZ units are ruggedized optical sensors designed to withstand the very conditions they are monitoring. These aren’t just for recording video; they serve as a critical layer of visual ground-truthing. When our sensors detect a change in wind speed or pressure, the PTZ camera can automatically swivel to the point of interest—allowing us to see the formation of wall clouds, debris, or precipitation in real-time.
The lens moves vertically, allowing for a look at both high-altitude cloud formations and ground-level impacts
Liquid Precision: The Smart Rain Gauge
The rain gauge is the primary component for measuring precipitation intensity and accumulation. Our systems typically utilize “Tipping Bucket” or “Optical” technology to provide high-resolution data. As droplets enter the collector, the sensor logs the volume in real-time, allowing our AI to calculate rainfall rates per minute.
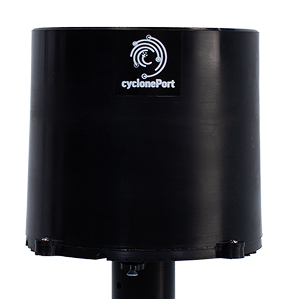
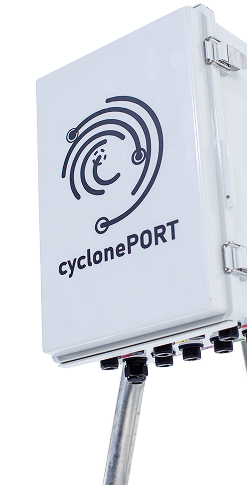
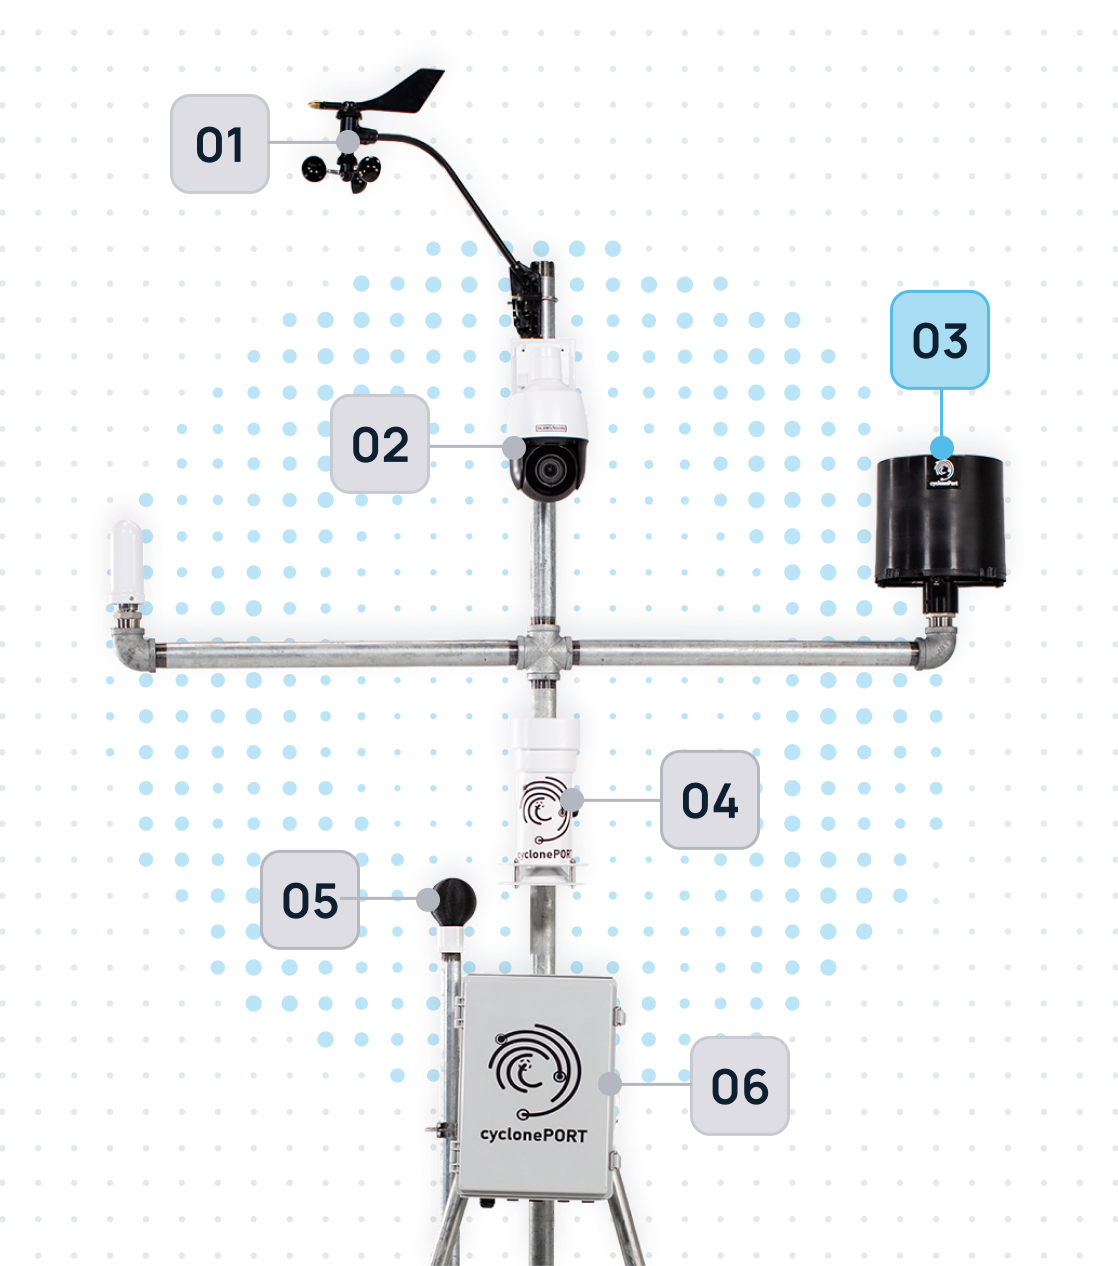
Resilience by Design: The Primary Sensor Housing
The Primary Sensor Housing is the ruggedized enclosure that integrates and protects the suite of meteorological instruments. It isn’t just a box; it is a precision-engineered environment. Designed with aerodynamic stability and thermal regulation, it ensures that internal components—like barometers, data loggers, and transmission hardware—stay dry, cool, and connected even in hurricane-force winds or sub-zero blizzards.
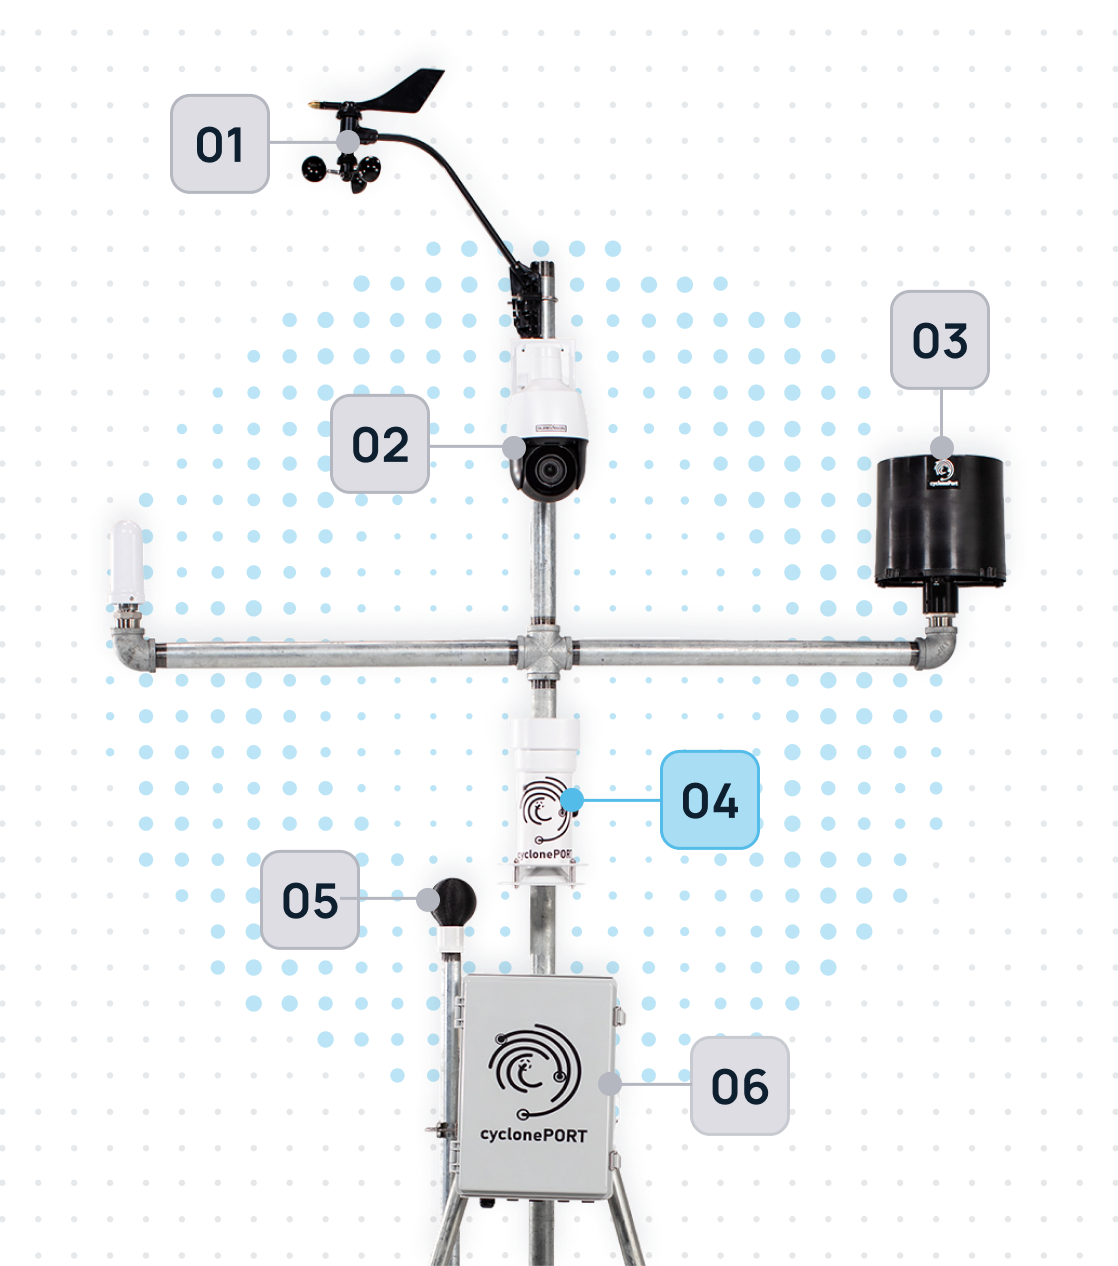
Human-Centric Heat Intelligence
The Wet Bulb Globe is the “biometric” sensor of our weather stations. It doesn’t just measure ambient air; it accounts for the three-way punch of temperature, humidity, and solar radiation. By simulating how a human being absorbs heat while sweating in direct sunlight, it provides the Wet Bulb Globe Temperature (WBGT)—the most accurate metric for predicting heat exhaustion and sunstroke.
For companies managing outdoor crews, sports events, or high-load data centers, this sensor is the definitive “go/no-go” signal for safety.
The Intelligence Engine: CyclonePORT Hub
The CyclonePORT Hub is the central nervous system of our weather monitoring architecture. It serves as the high-speed bridge between raw environmental data and actionable cloud intelligence. While our sensors are busy “feeling” the storm, the Hub is busy translating those signals, encrypting the data, and ensuring it reaches our forecasting models in milliseconds—even when local power grids or traditional networks fail.
It is designed for “Edge Computing,” meaning it processes critical data locally to provide instant alerts before the information even hits the cloud.