You have your new, professional-grade cyclonePORT weather surveillance system. Now what? The most accurate sensor on Earth can’t protect your assets if it’s not set up correctly.
The idea of configuring networked sensors, edge computing hubs, and optical surveillance units might sound daunting, but the good news is that cyclonePORT is designed for seamless hardware integration. It’s a professional-grade commercial solution that manages to keep the user experience straightforward.
Here is a straightforward walkthrough to take you from a sealed crate to a live, operational Operations Center view, without requiring a degree in networking.
Phase 1: Planning Your Deployment
The most critical step in setup happens before you pick up a screwdriver. You need to identify the perfect placement for your sensors.
The Golden Rules of Sensor Placement:
Network Visibility: Remember, these are IoT (Internet of Things) devices. The placement must be within range of your planned network connection (cellular, Wi-Fi, or Ethernet).
Representativeness: A sensor placed behind a building or under a tree will only measure that building’s shadow or that tree’s canopy. You need a location that accurately represents the entire operational area you are protecting (e.g., a rooftop for an EOC, an open pole near the field for a sports complex).
Clearance: Your PTZ Observation Unit needs an unobstructed line of sight. Your Anemometer needs to be high enough to catch true wind speeds, not just turbulent air currents swirling off other equipment.
Phase 2: Hardware Assembly
Once you’ve confirmed your location, it’s time to build the “nervous system.”
1. Mounting the Hub: The CyclonePORT Hub is the central nervous system. This ruggedized edge-computing unit is designed to bridge raw data with cloud intelligence. Mount it first—usually to a sturdy pole or wall—as it serves as the connection point for all other sensors.
2. Deploying the Sensors: Assemble your suite of instruments. This generally includes:
- PTZ Camera: The ruggedized “optical sensor” designed to provide live visual ground-truthing.
- Anemometer: Use the ultrasonic array (moving beyond old-fashioned mechanical cups) to capture precise, lag-free wind velocity and direction.
- Primary Sensor Housing: Assemble the main ruggedized enclosure, which integrates and protects key barometers and data loggers.
- Smart Rain Gauge: Use the tipping-bucket or optical tech to log volume in real-time.
3. Connecting the Pieces: cyclonePORT utilizes commercial-grade, keyed, waterproof connectors. Connect all your sensors to the Hub. Because the system is designed for hardware integration, the Hub will automatically detect which instruments are attached.
Phase 3: The Digital Connection (Configuration)
The hardware is up; now, we make it “smart.”
1. Powering On: Apply power to the CyclonePORT Hub.
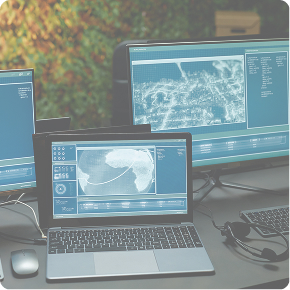
2. Initial App Connection: Download the cyclonePORT configuration app. The system will create its own local hotspot. Connect your phone or tablet to this hotspot to access the initial, user-friendly setup interface.
3. Providing Network Access: In the app, you will input your actual networking credentials (e.g., the local 5G cellular APN or the university Wi-Fi password). The Hub uses Edge Computing to begin translating and encrypting these signals immediately.
Phase 4: Finalizing in the Cloud (cyclonePORT Enterprise)
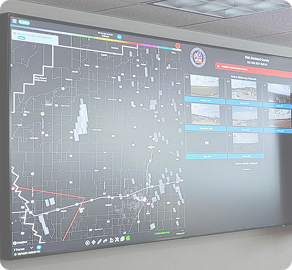
The system is now “calling home.” Your final steps happen from the safety of your office using the cyclonePORT Enterprise suite.
1. System Adoption: Log in to your enterprise account. You will see a prompt to “adopt” the new hardware suite. Use the serial number found on the Hub to link the sensors to your dashboard.
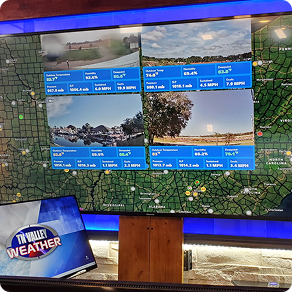
2. Verify Live Streams: Confirm you are receiving raw environmental data (WBGT, lightning proximity, wind statistics) and that the livestreaming video from your PTZ units is active. Verify that your sensor upload average is in the commercial standard range (often around 4 seconds).
3. Creating Alerts: This is where the magic happens. Navigate to the advanced reporting tools. Don’t wait for a storm; configure your customizable alert system now (e.g., “Alert the field crew if WBGT exceeds 86°F” or “Issue a lightning proximity warning within 8 miles”).
Seamless Integration, Unparalleled Intelligence
By following this walkthrough, you have transformed a suite of technical meteorological instruments into a functioning shield for your community and assets. From university campuses to utility grids, this process is designed to deliver Best-in-Class data as fast as possible, translating into measurable impact when seconds decide outcomes.